This topic contains a solution. Click here to go to the answer
|
|
|

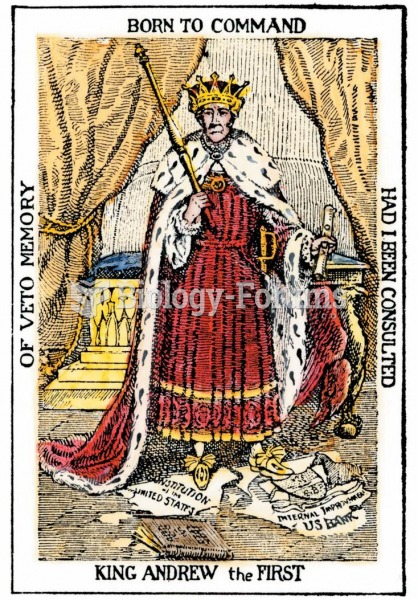 A cartoon of “King Andrew the First” shows Jackson standing atop the U.S. Constitution—a scepter in
 Demonstrate the Application of Triangular, Figure-Eight, and Tubular Bandages
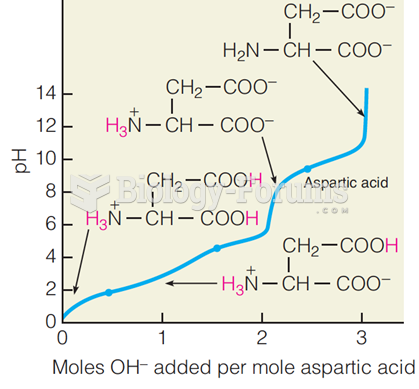 Titration curve for aspartic acid
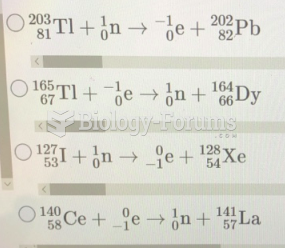 Which of the following reactions correctly shows the transmutation of an element by neutron ...
 Lod Score Values for the Families in Figure 5.15
 Meiosis is used to make sperm and egg cells. A shows a simplified version and B shows a detailed ver