This topic contains a solution. Click here to go to the answer
|
|
|

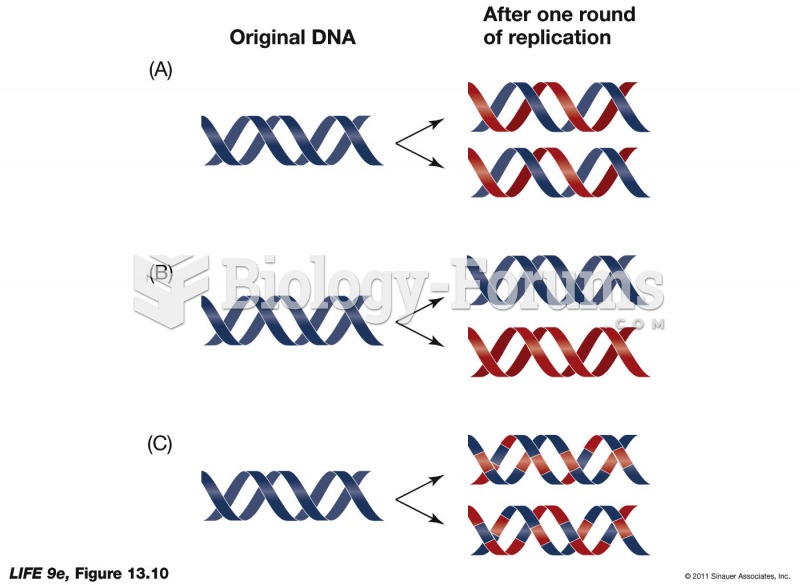 Three Models for DNA Replication
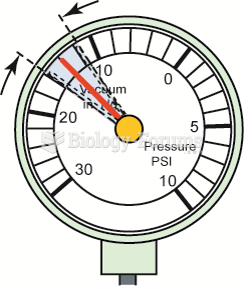 An oscillating needle 1 or 2 inches Hg below normal could indicate an incorrect air–fuel mixture ...
 Models of Pattern Perception
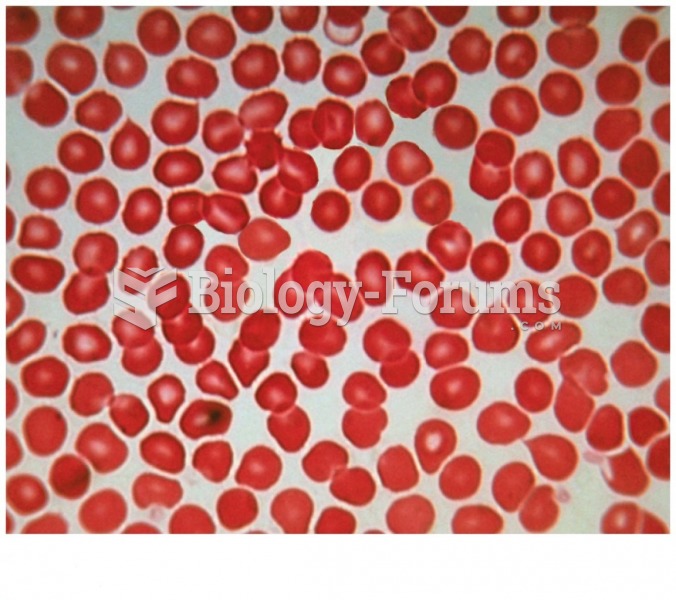 Normal Red Blood Cells
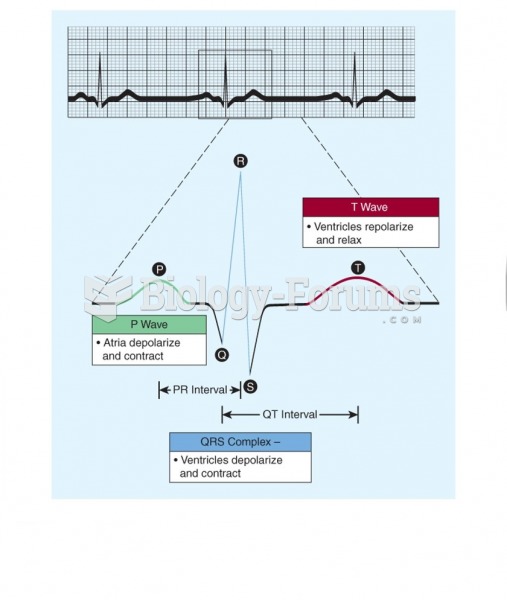 Normal electrocardiogram tracing
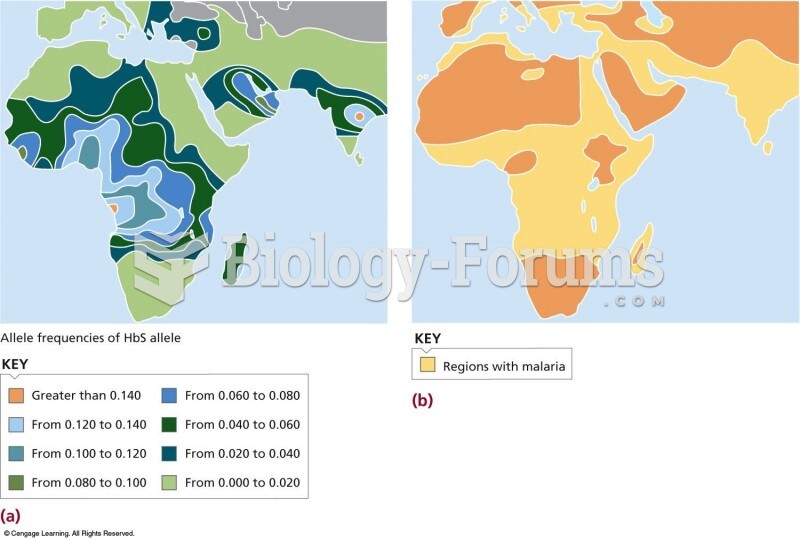 (a) The distribution of sickle cell anemia in the Old World. (b) The distribution of malaria overlap