This topic contains a solution. Click here to go to the answer
|
|
|

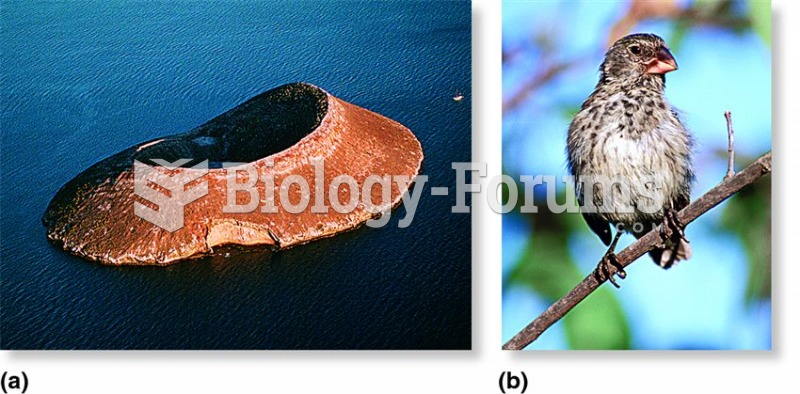 The Grants' investigation of natural selection in finches.
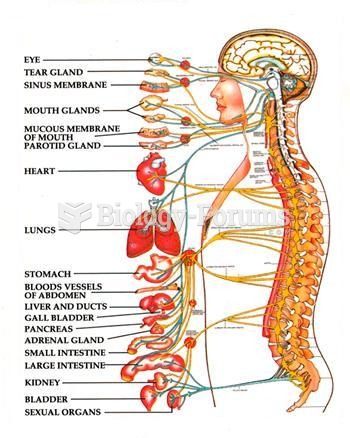 SPINAL NERVES DIAGRAM
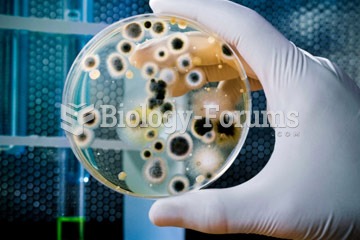 Bacteria Diagram
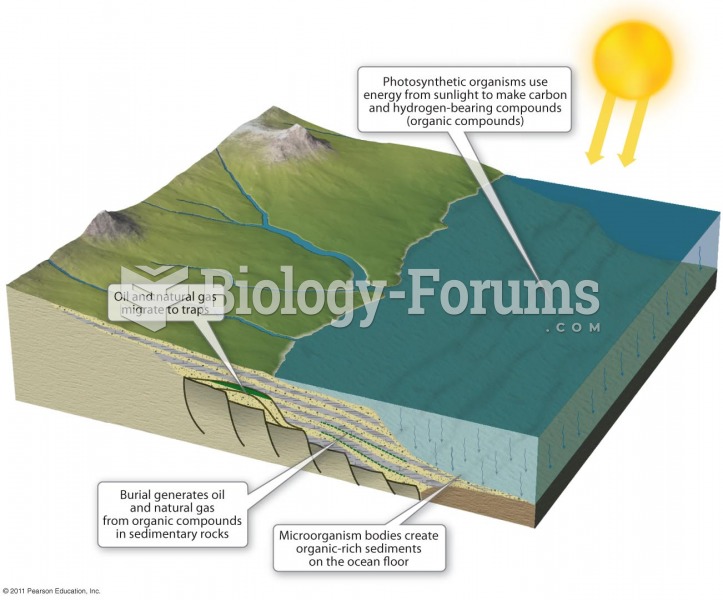 How Oil and Natural Gas Form
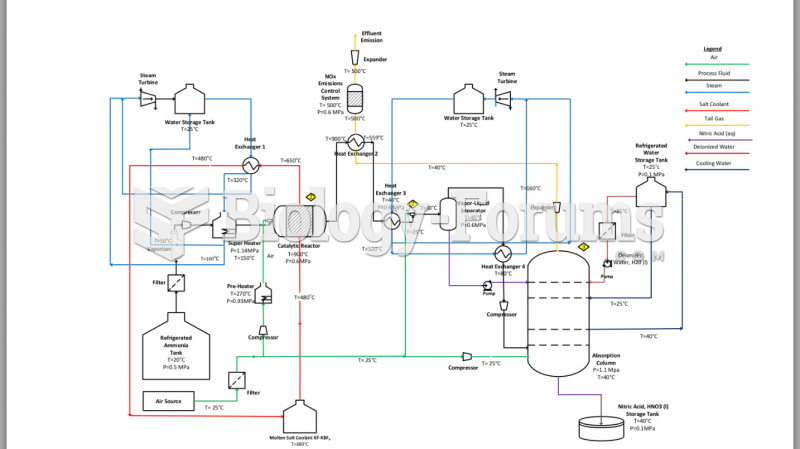 Process Flow Diagram of a Dual-Stage Pressure System
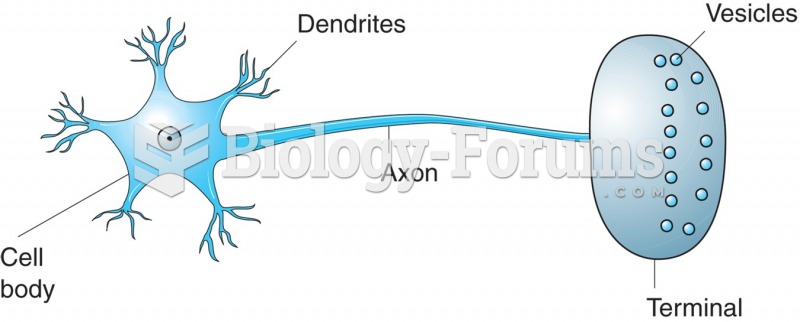 Diagram of a neuron.