This topic contains a solution. Click here to go to the answer
|
|
|

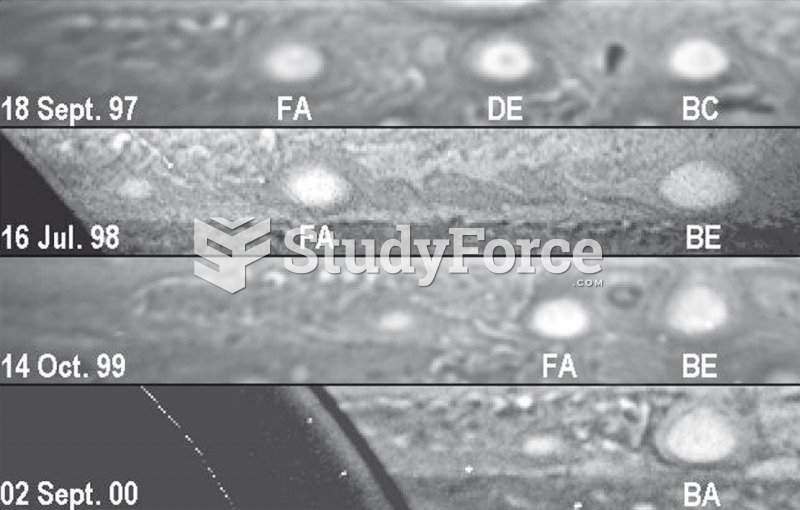 Creating Red Spot
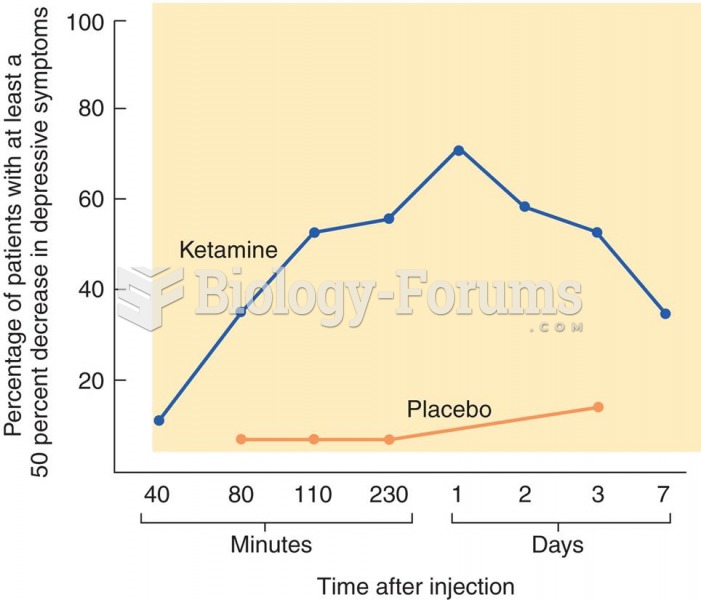 Treatment of Depression with Ketamine The graph shows the effects of ketamine on symptoms of depress
 Acquiring Weather Data
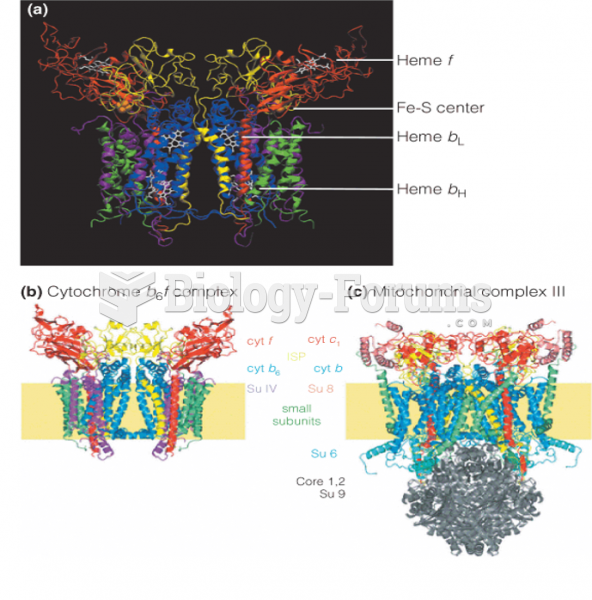 Structure of the cytochrome b6f complex
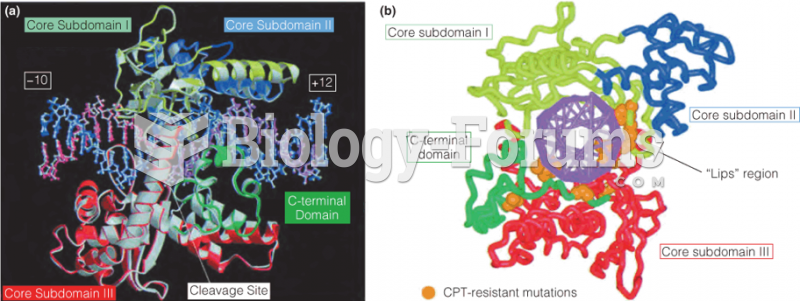 Crystal structure of human topoisomerase I in complex with a 22-bp DNA duplex
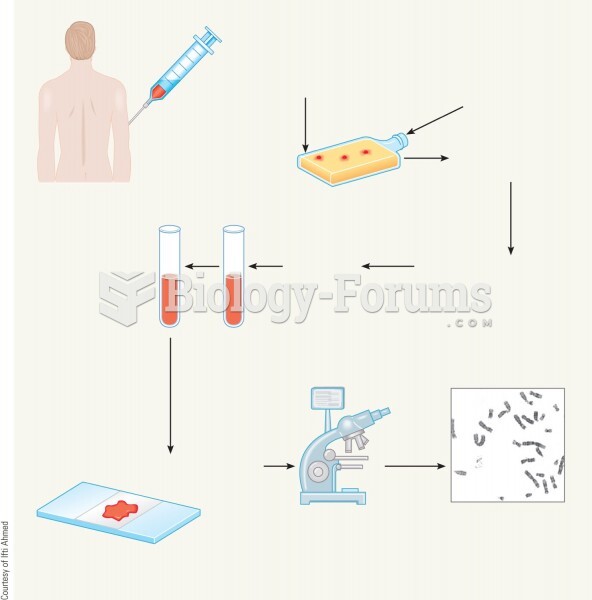 The steps in the process of creating a karyotype for chromosome analysis.