This topic contains a solution. Click here to go to the answer
|
|
|

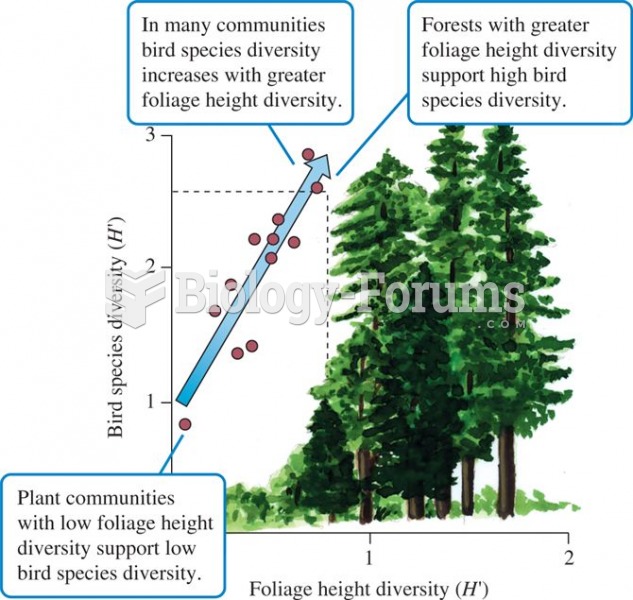 Foliage height diversity and bird species diversity (data from MacArthur and MacArthur 1961).
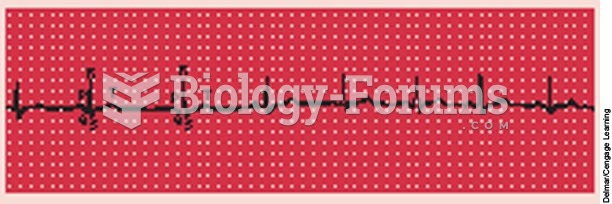 An ECG strip showing a normal sinus rhythm with the P wave, QRS complex, and T wave identified.
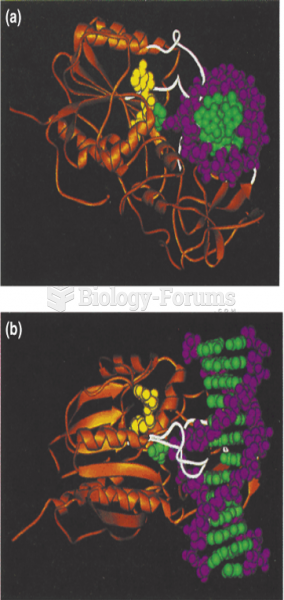 Structure of a complex of a type II DNA methylase with DNA
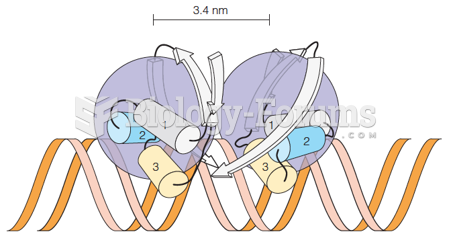 Structural model of the Cro dimer–operator complex
 Data management questions
 Data management short answer q