This topic contains a solution. Click here to go to the answer
|
|
|

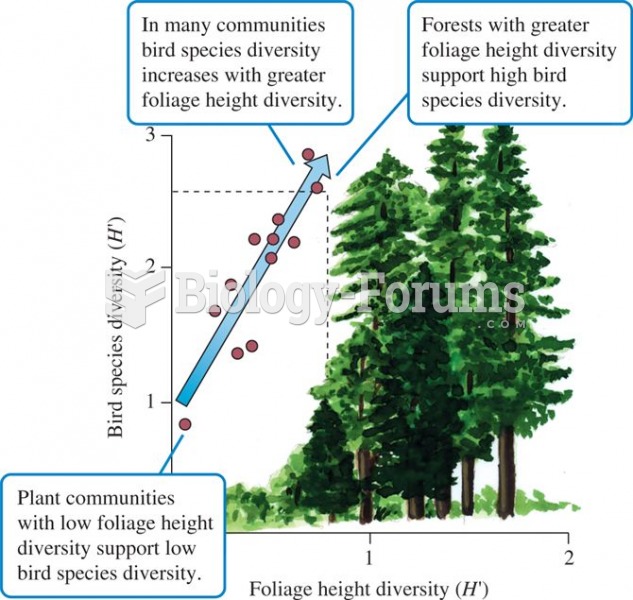 Foliage height diversity and bird species diversity (data from MacArthur and MacArthur 1961).
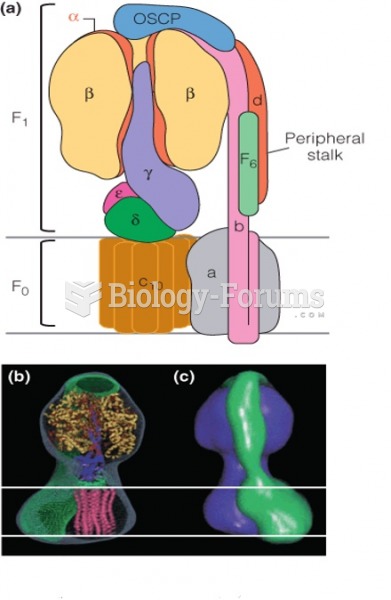 Structure of the F0F1 complex
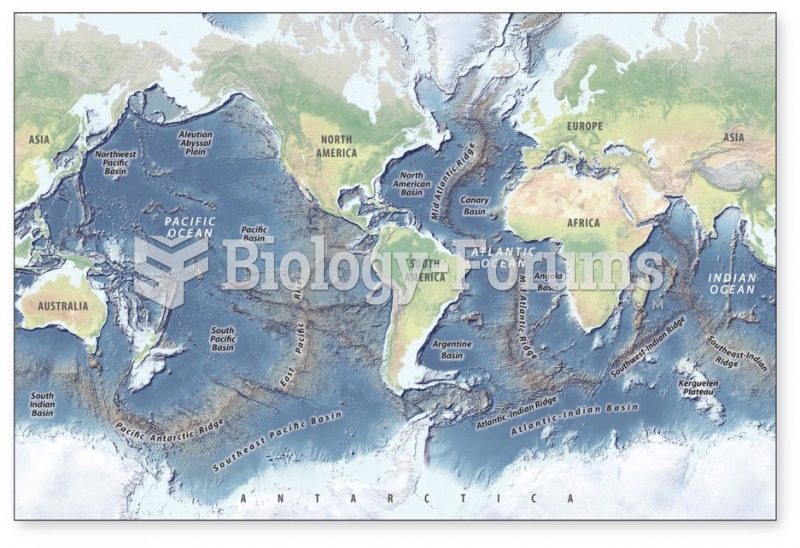 The path of the conveyor is complex and affected by deep ocean topography
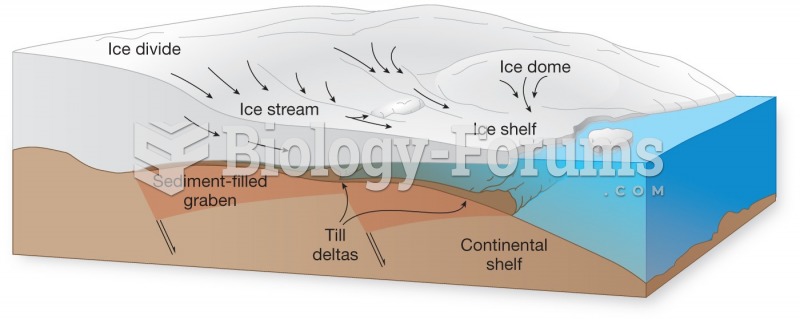 Ice sheet growth and decay is complex
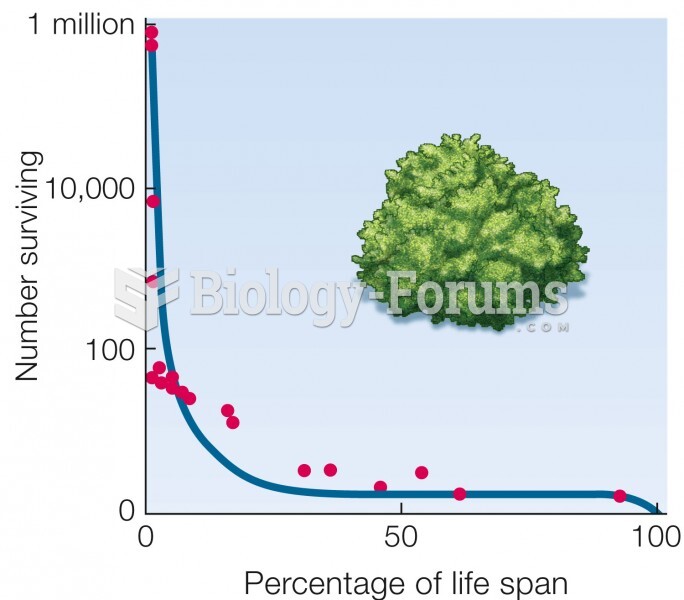 Type III curve. Mortality is highest early in life. Data for a desert shrub (Cleome droserifolia).
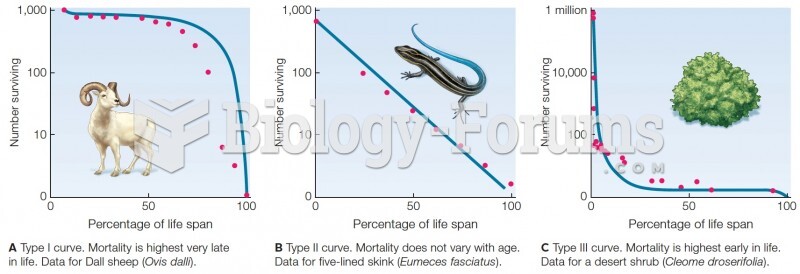 Survivorship curves. Blue lines are theoretical curves. Red dots are data from field studies.