This topic contains a solution. Click here to go to the answer
|
|
|

 Some of the fastest growing religions in America are non-Judeo-Christian religions. This photograph
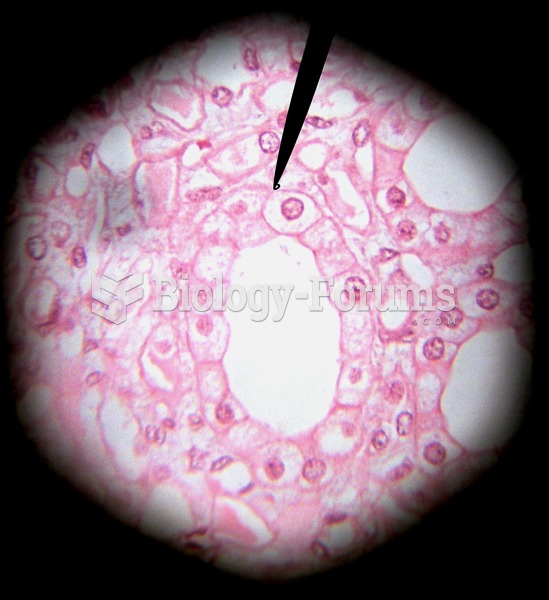 Simple cuboidal
 In 2008, the U.S. economy suffered a gaping wound as several trillion dollars were ripped out of it.
 The end of a typical line wrench, which shows that it is capable of grasping most of the head of ...
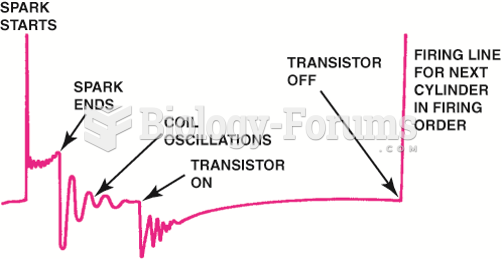 Drawing shows what is occurring electrically at each part of the scope pattern.
 Complete the following production chart and plot the points.