This topic contains a solution. Click here to go to the answer
|
|
|

 Wasp ocelli (simple eyes) and dorsal part of the compound eyes; also showing fine, unbranched hairs
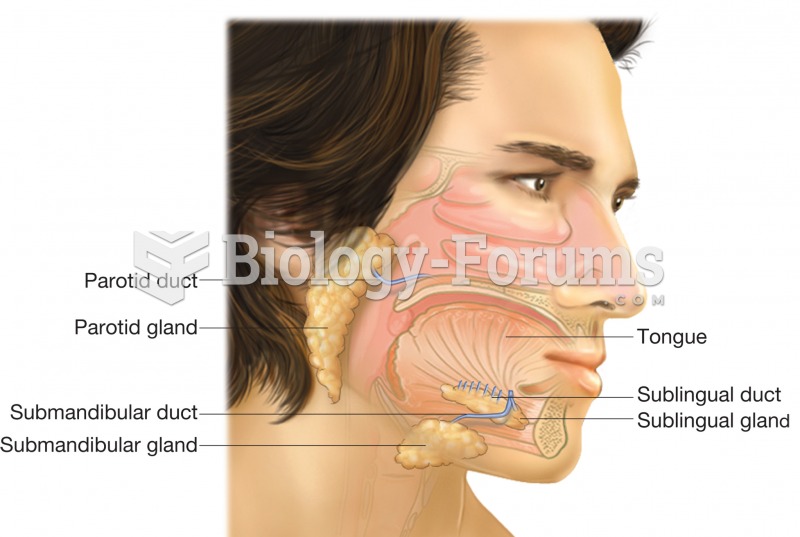 The salivary glands, parotid, sublingual, and submandibular. This image shows the position of each g
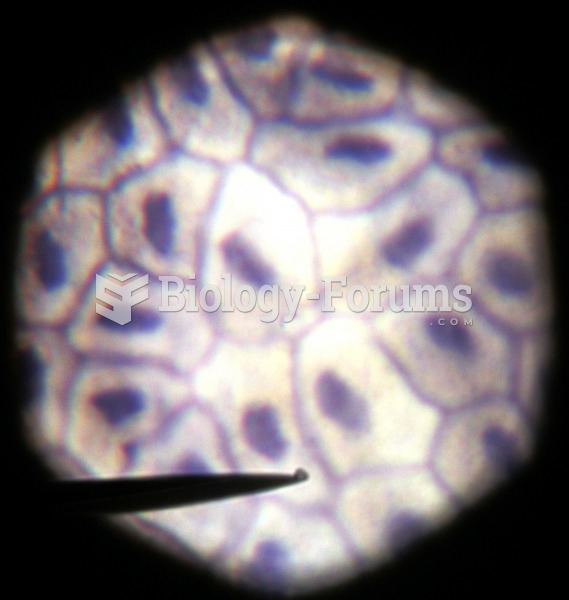 simple squamous
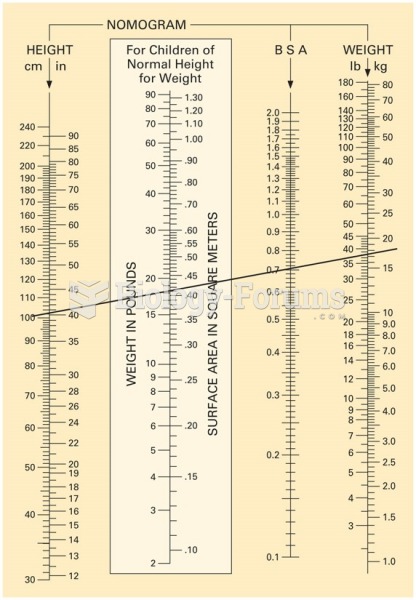 Nomogram chart. This example shows a line drawn from a child’s height of 100 cm to his weight, 35 ...
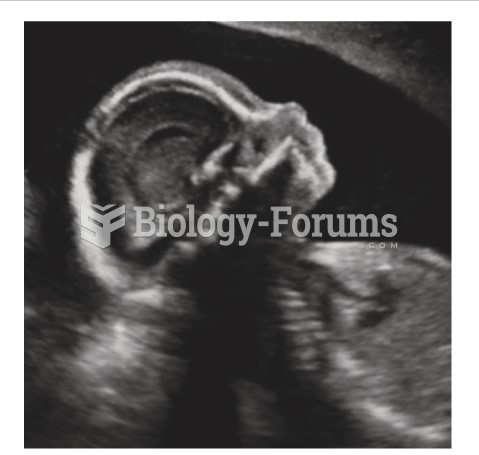 This image shows a normal third-trimester fetal brain
 Table - Correlation Analysis