This topic contains a solution. Click here to go to the answer
|
|
|

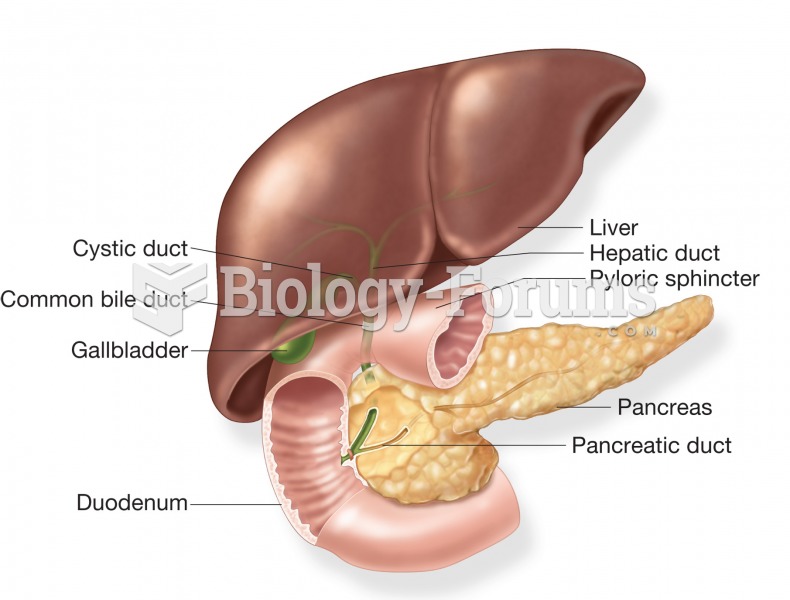 The accessory organs of the digestive system: the liver, gallbladder, and pancreas. Image shows the
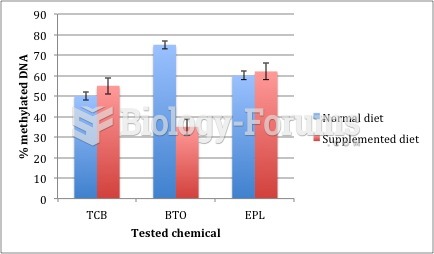 Graph of 3 compounds tested
 A Simple Model of the Learning Process
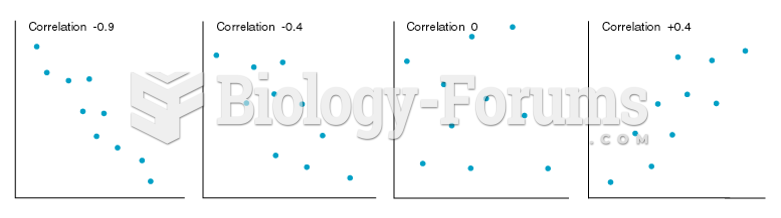 Scatterplots of Variables Having Several Different Levels of Correlation
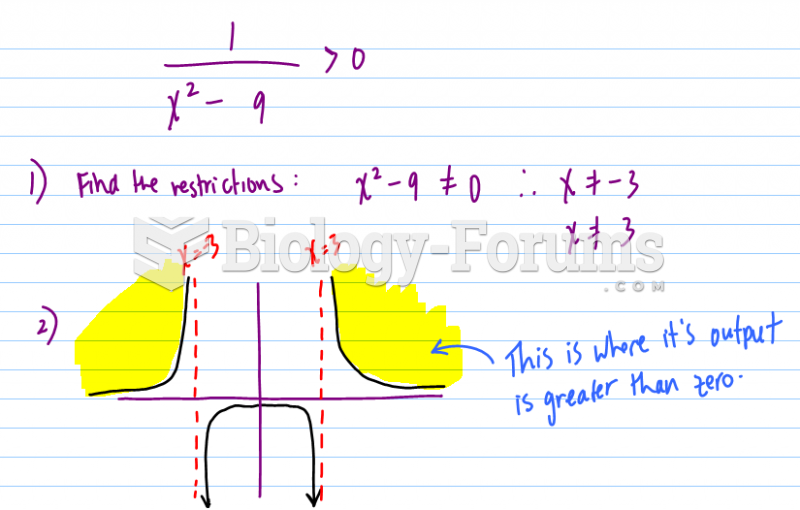 To satisfy the inequality, sketch the following function by hand and shade the graph regions.
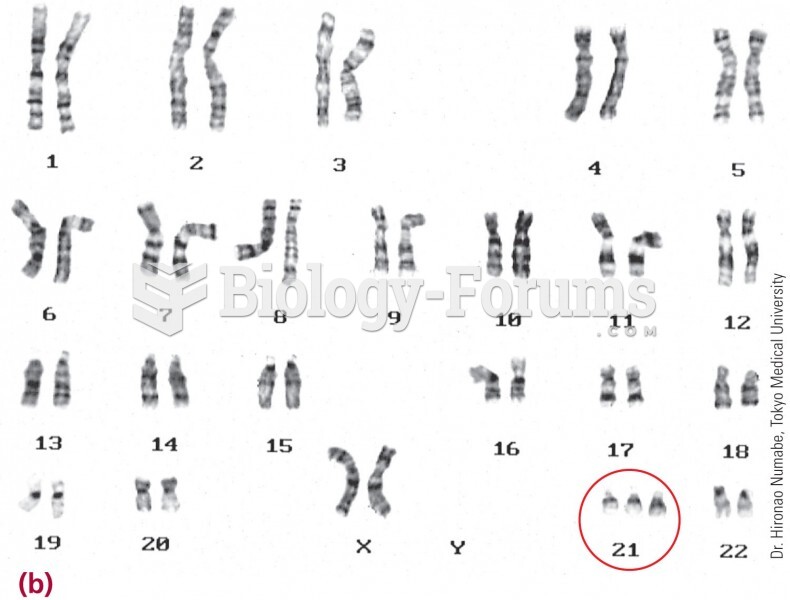 A karyotype shows this child has three copies of chromosome 21.