This topic contains a solution. Click here to go to the answer
|
|
|

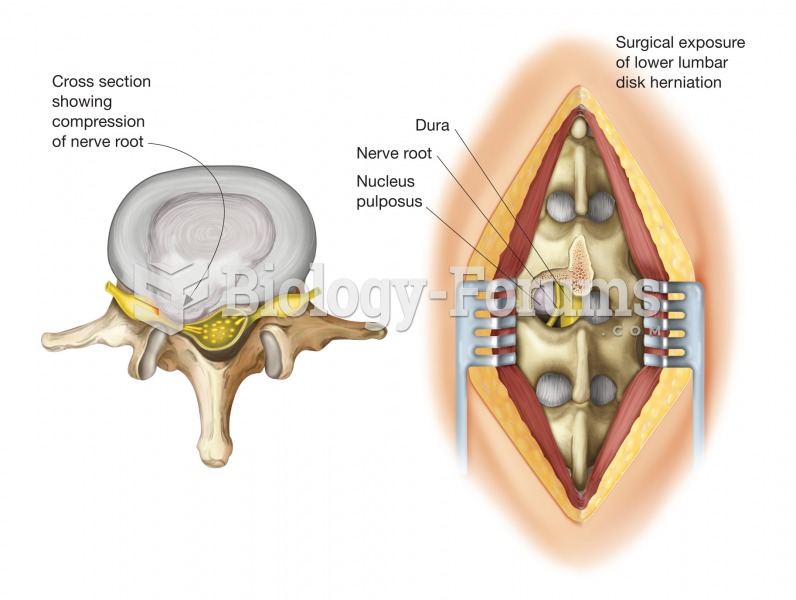 Herniated disk. A herniated disk is a protrusion of the disk’s gelatinous center, called the nucleus
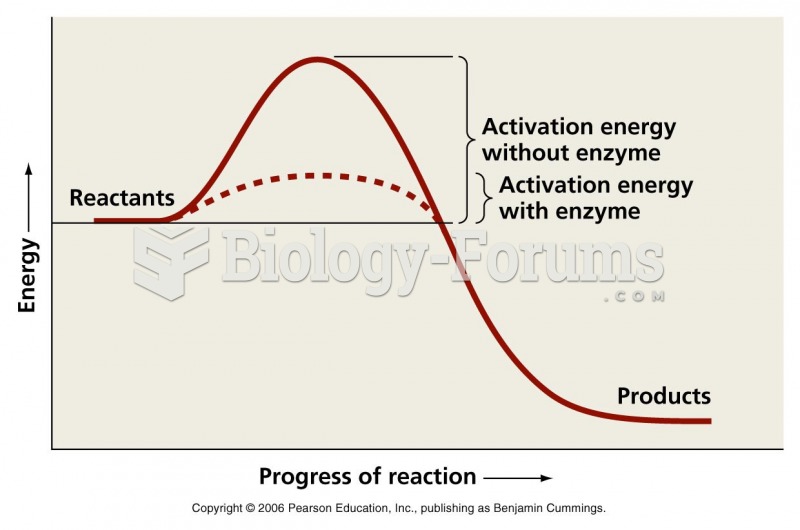 Activation energy graph
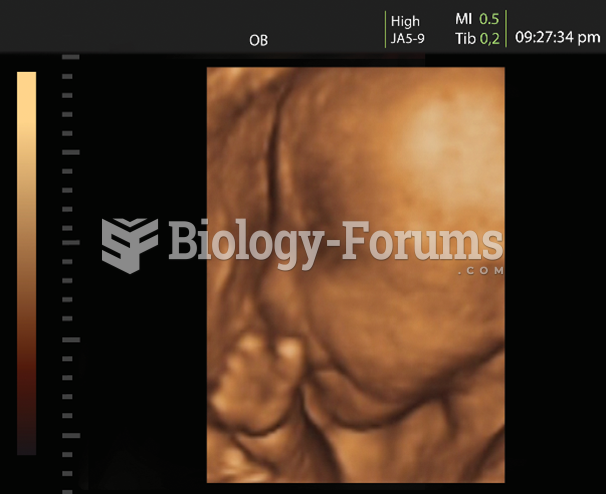 The photo shows an ultrasound image of a fetus. The rough outline of a head and body can be seen. ...
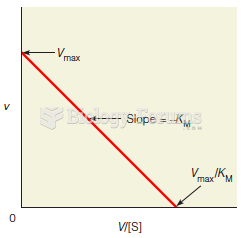 An Eadie–Hofstee plot
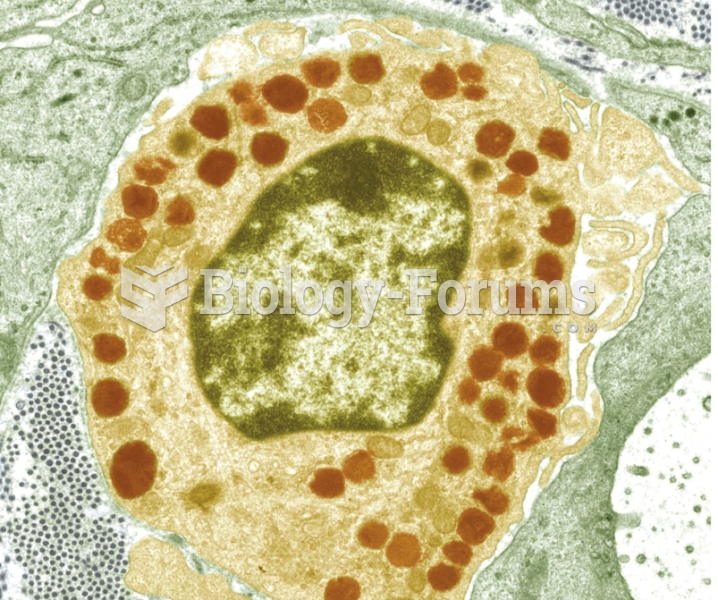 A Gaucher cell showing accumulated fat stored in structures called lysosomes
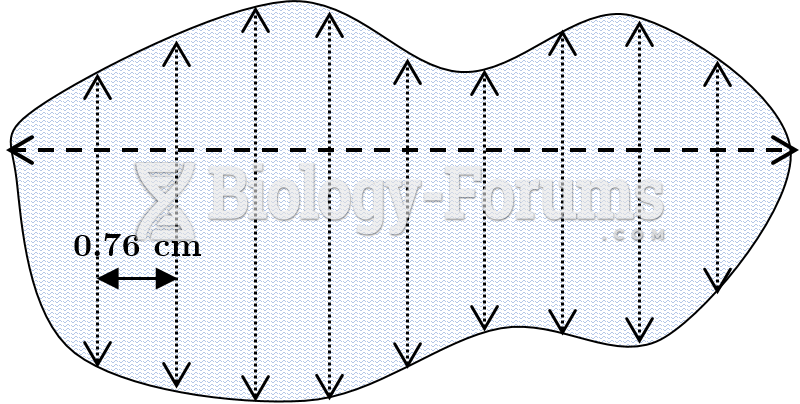 Offset Method Plot of Land with Offset Lines