|
|
|

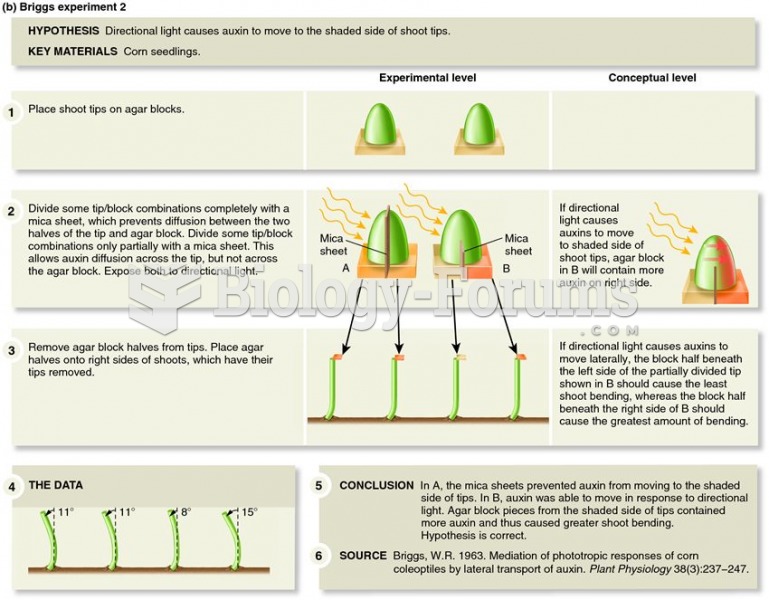 Went and Briggs demonstrated the relationship between light perception and auxin function.
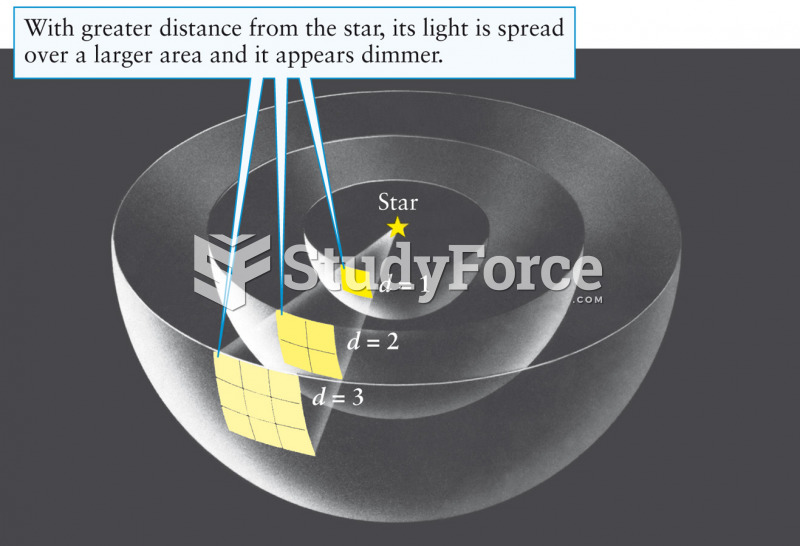 The Inverse-Square Law
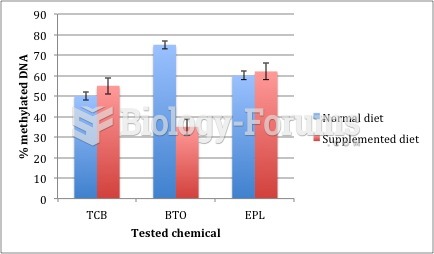 Graph of 3 compounds tested
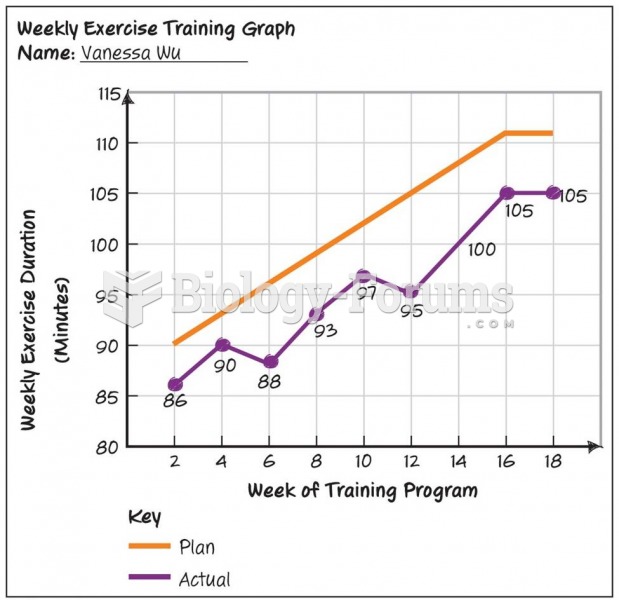 Progression Graph: Fitness Plan
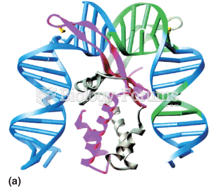 Integrative recombination in phage l: DNA bending by IHF, shown by X-ray crystallography
 Variable expressivity as shown in flies homozygous for the eyeless mutation in Drosophila