|
|
|

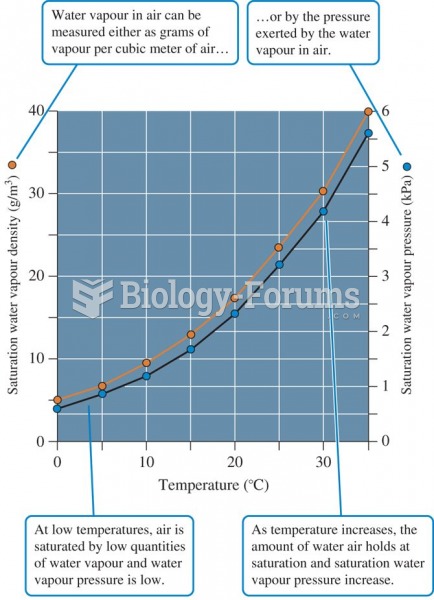 The relationship between air temperature and two measures of water vapour saturation of air.
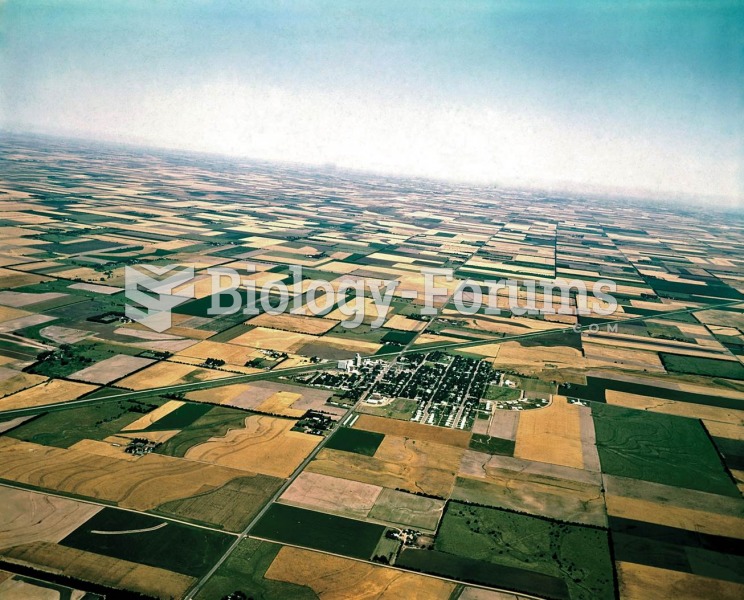 The Land Ordinance of 1785 called for surveying and dividing the Western Territories into square mil
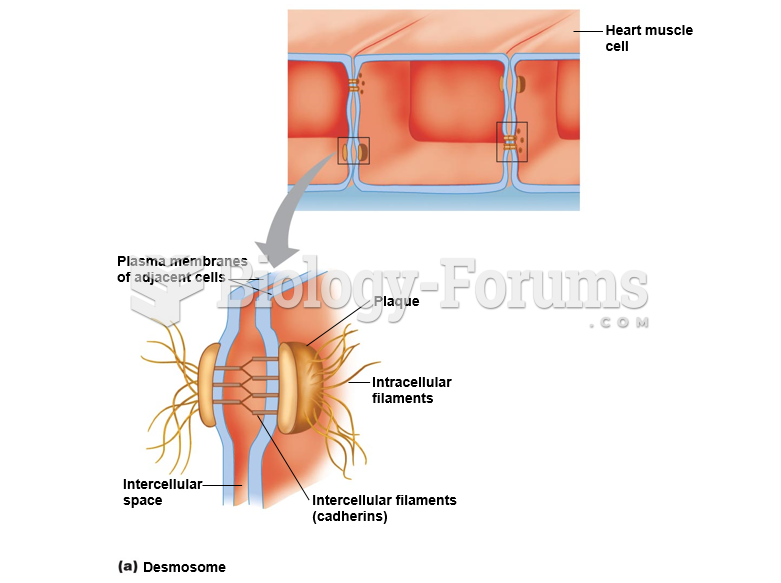 Desmosomes and gap junctions, as shown in heart muscle: Desmosome
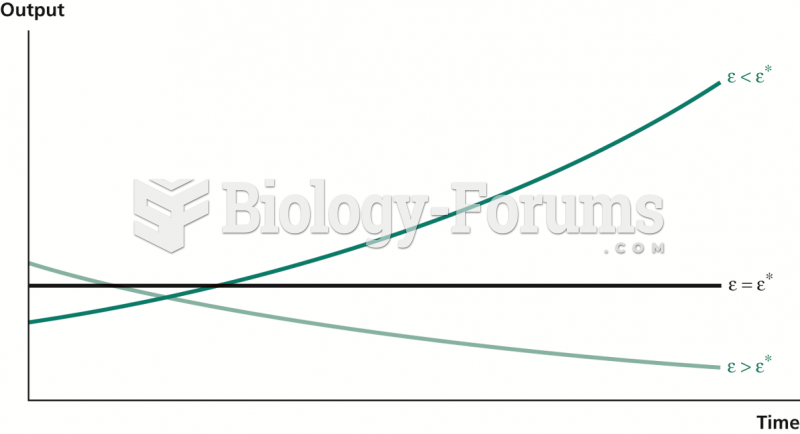 Relationship between Resource Use and Growth
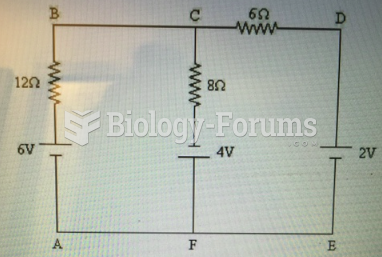 Identify the junction nodes in the circuit shown in Figure 21-1.
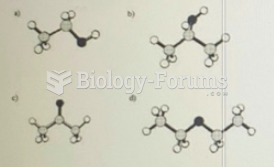 Ethanol has the molecular formula C2H6O. Which ball and stick model shown above represents ...