|
|
|

 The degree of cerebral cortex folding in different mammalian species. The brains are not shown to sc
 Establishing a caring and trusting relationship helps the client come to terms with a terminal illne
 How to integrate using inverse trigonometric substitution (Question 1)
 Relationship between Income per Capita and Population Growth
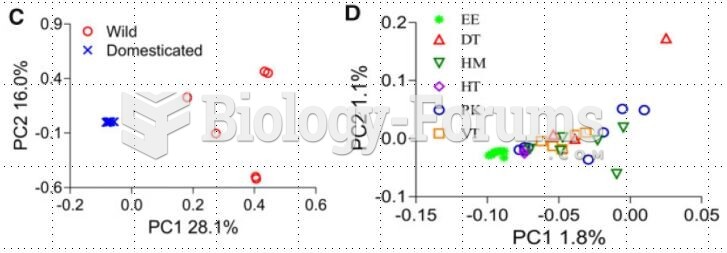 How to interpret these PCA Graph?
 For toluene (shown below), you would expect to see which m/z fragment in the mass spectrum?