This topic contains a solution. Click here to go to the answer
|
|
|

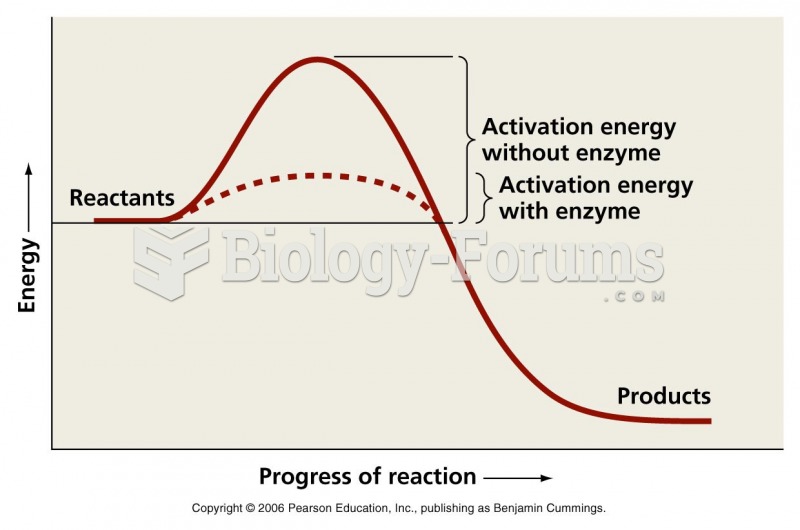 Activation energy graph
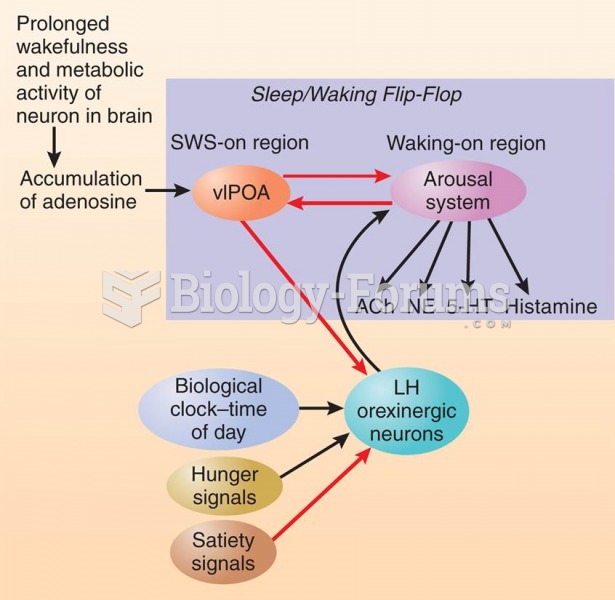 Adenosine, Time of Day, and Hunger
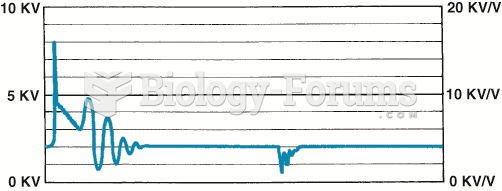 A downward-sloping spark line usually indicates high secondary ignition system resistance or an ...
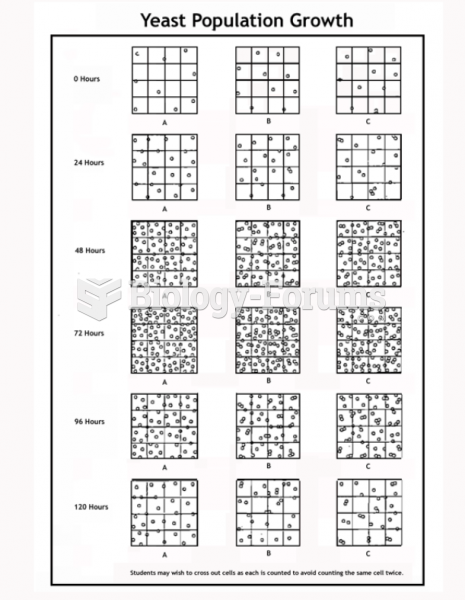 Bio Chart
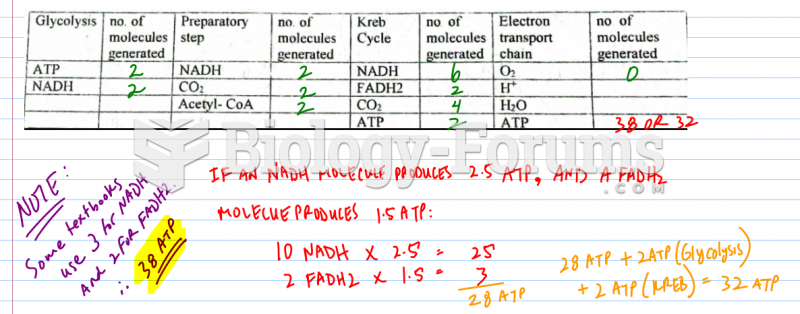 Cellular Respiration Chart (ATP)
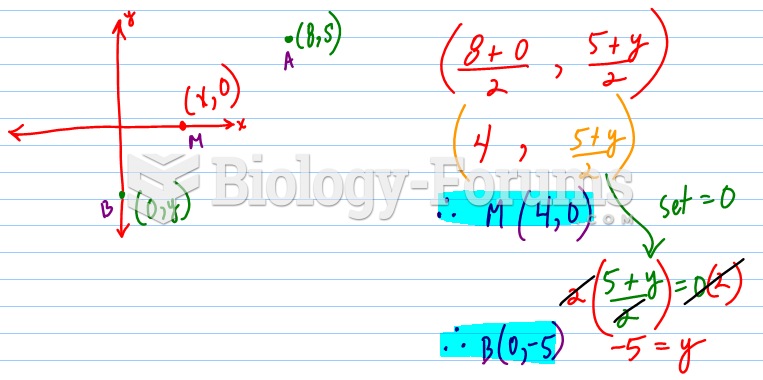 M is the midpoint of a line segment with endpoints A & B. If B is locates on the y-axis, and M ...