This topic contains a solution. Click here to go to the answer
|
|
|

 This image shows an artists depiction of a 10-kilometer (six-mile) diameter astero
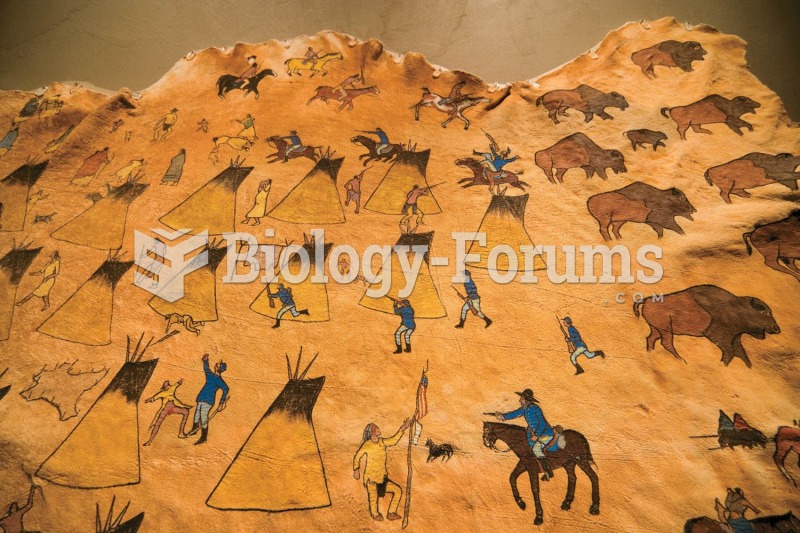 This Native American depiction of the Sand Creek Massacre, painted on a buffalo hide, shows the Indi
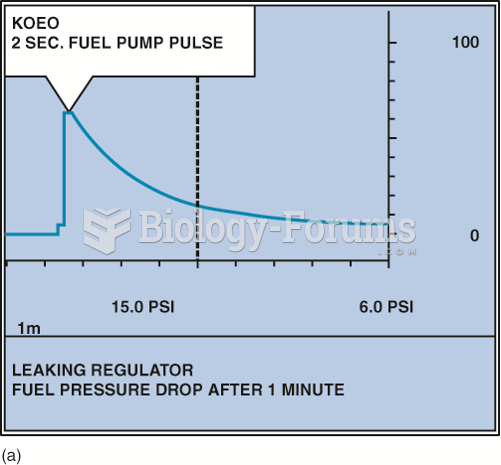 A fuel-pressure graph after key on, engine off (KOEO) on a TBI system.
 With the research technique called brainbow, each neuron is labeled with a different color, ...
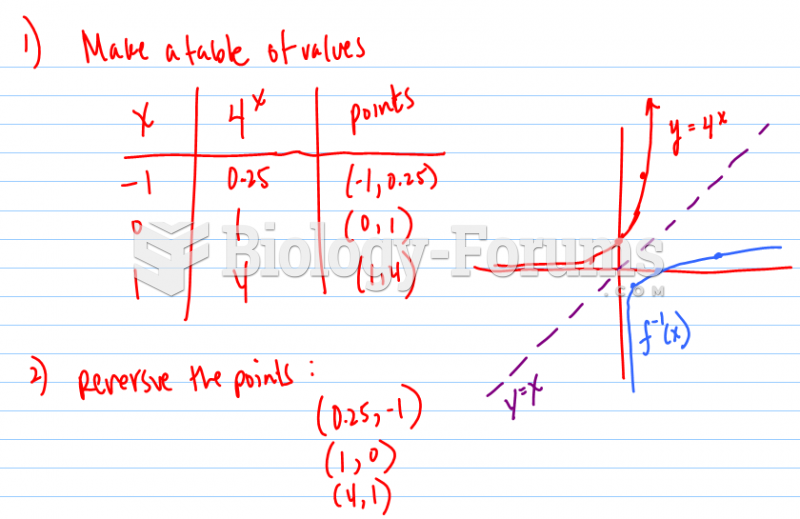 Sketch a graph of the inverse of each exponential function.
 Graph Liters per Hour