This topic contains a solution. Click here to go to the answer
|
|
|

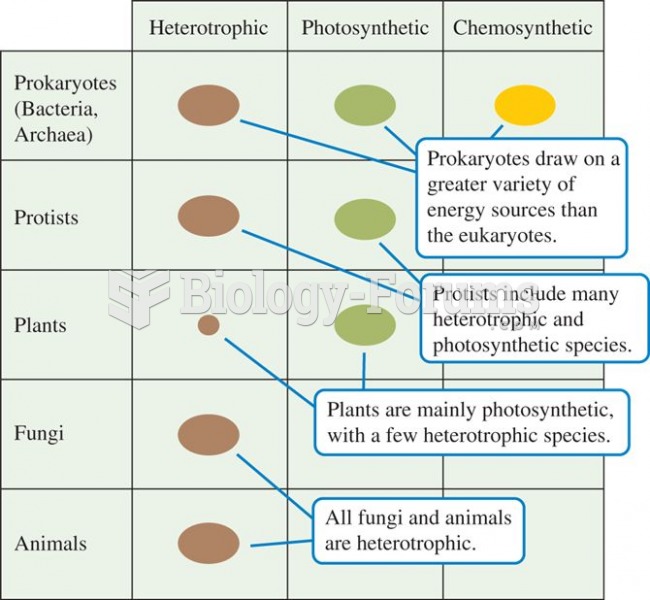 A plot of trophic diversity across the major groups of organisms shows highest trophic diversity amo
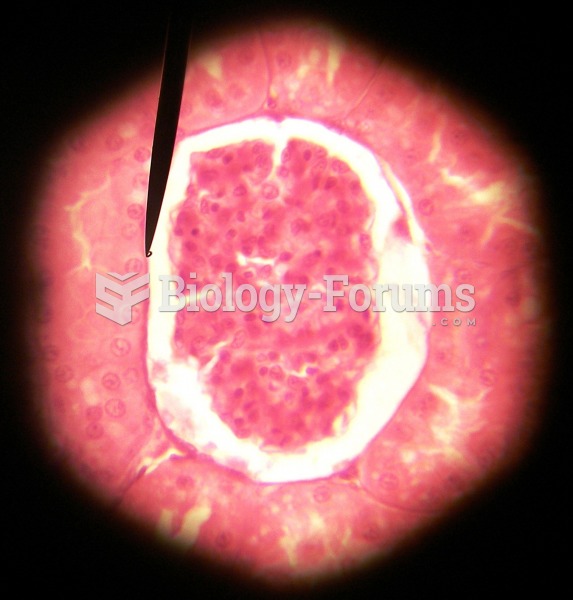 simple squamous kidney
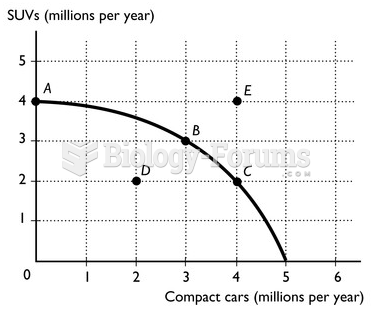 graph
graph
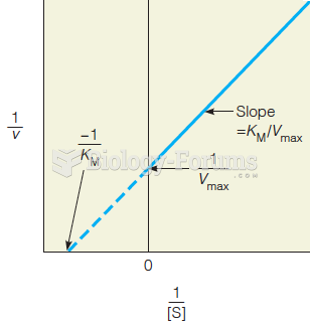 A Lineweaver–Burk plot
 How to calculate simple interest (Part 2)
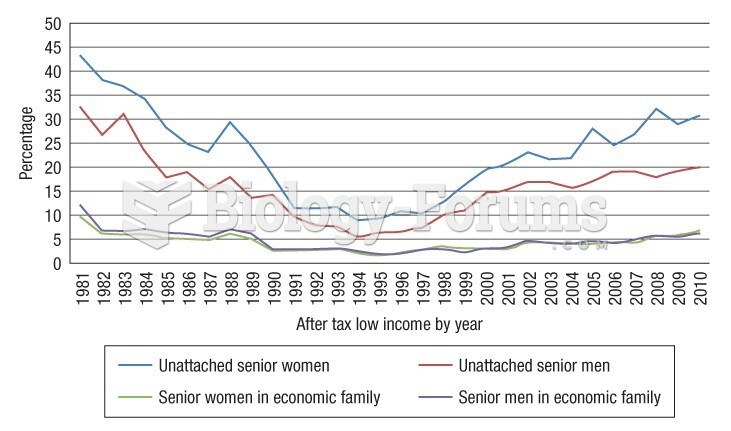 This graph illustrates how unattached older adults are poorer than their peers who live in families