 |
| Previous Image | Next Image |
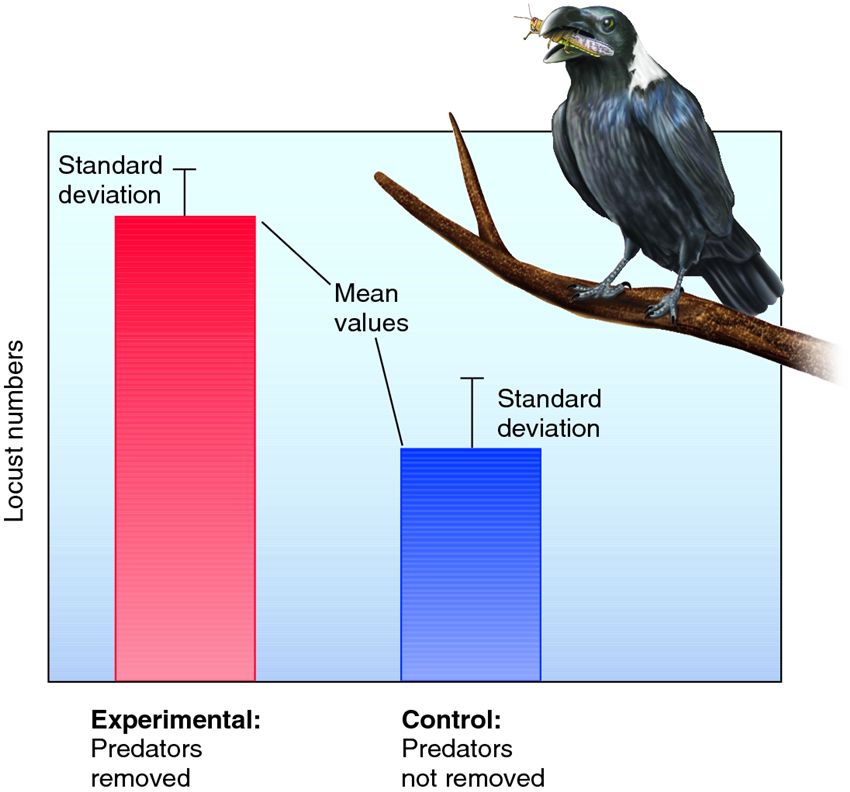
| Description: The two bars represent the average number of locusts where predators are removed (experimental) and where predators are not removed (control). The vertical lines (the standard deviations) give an indication of how tightly the individual replicate results are clustered around the mean. The shorter the lines, the tighter the cluster, and the more confidence we have in the result.
Picture Stats: Views: 1467 Filesize: 67.4kB Height: 792 Width: 850 Source: https://biology-forums.com/index.php?action=gallery;sa=view;id=1329 |