 |
| Previous Image | Next Image |
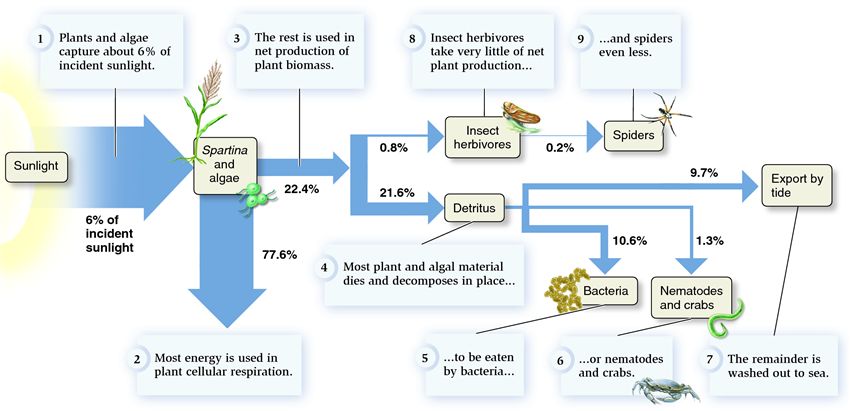
| Description: Numbers reflect percentages of gross primary production that flows into different trophic levels or is used in plant respiration.
Picture Stats: Views: 8424 Filesize: 52.46kB Height: 411 Width: 850 Source: https://biology-forums.com/index.php?action=gallery;sa=view;id=1443 |