 |
| Previous Image | Next Image |
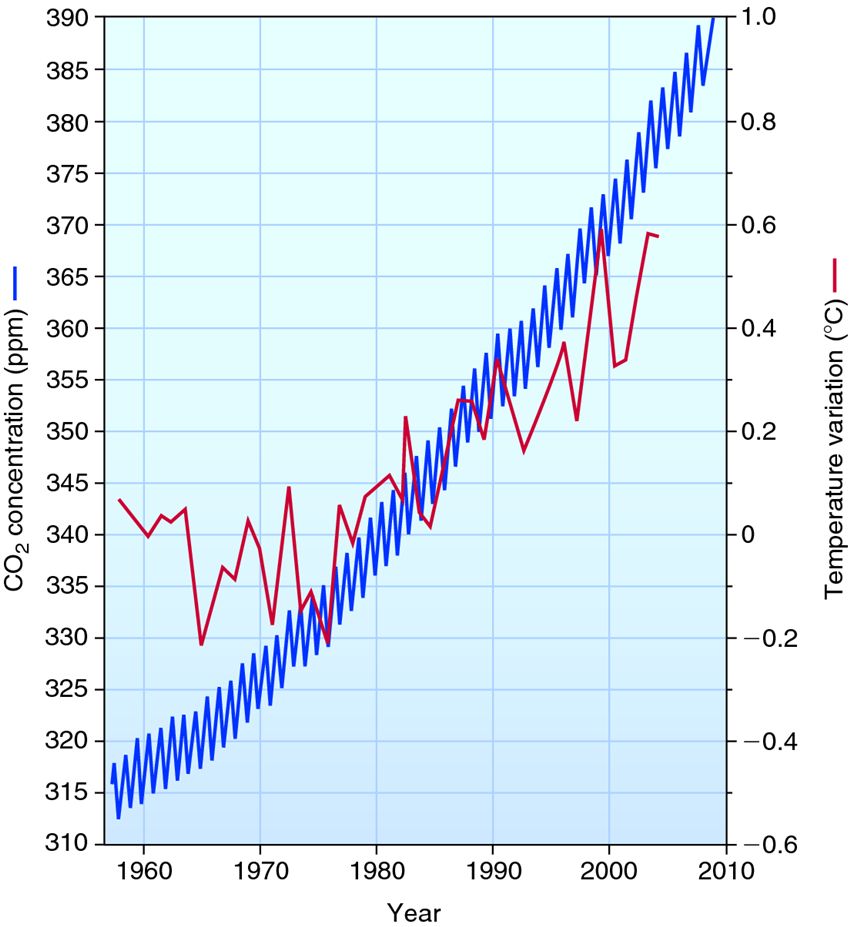
| Description: From 1958 to 2004, atmospheric CO2 shows an increase of nearly 20%. In addition, the graph shows a seasonal variation in CO2. Temperatures are annual deviations from the 1961–1990 average. Measurements were recorded at Mauna Loa Observatory in Hawaii.
Picture Stats: Views: 1192 Filesize: 93.07kB Height: 927 Width: 850 Source: https://biology-forums.com/index.php?action=gallery;sa=view;id=1447 |
