 |
| Previous Image | Next Image |
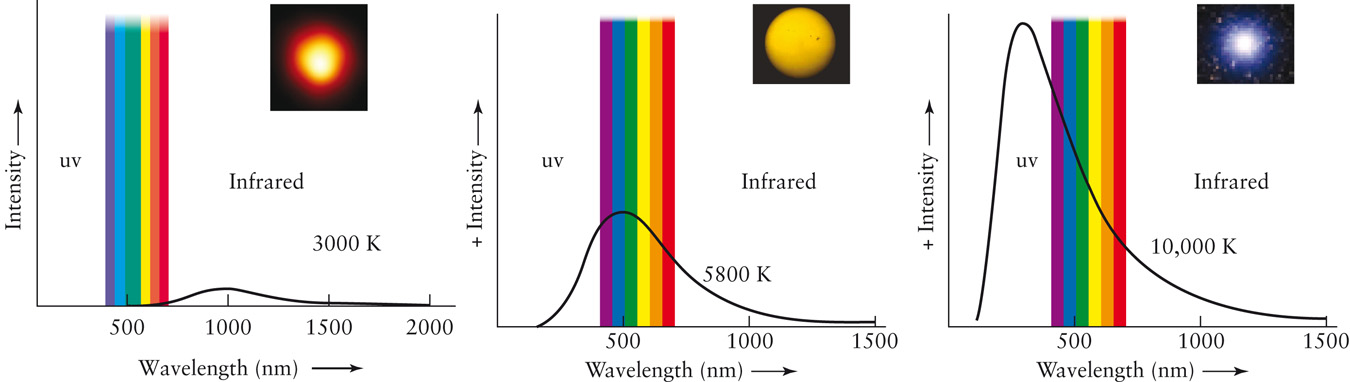
| Description: Temperature and Color (b) These diagrams show the relationship between the color of a star and its surface temperature. The intensity of light emitted by three stars is plotted against wavelength (compare with Figure 4-2). The range of visible wavelengths is indicated. The location of the peak of each star’s intensity curve, relative to the visible-light band, determines the apparent color of its visible light. The insets show stars of about these surface temperatures. Ultraviolet (uv) extends to 10 nm. Picture Stats: Views: 689 Filesize: 110.64kB Height: 382 Width: 1350 Source: https://biology-forums.com/index.php?action=gallery;sa=view;id=18384 |