 |
| Previous Image | Next Image |
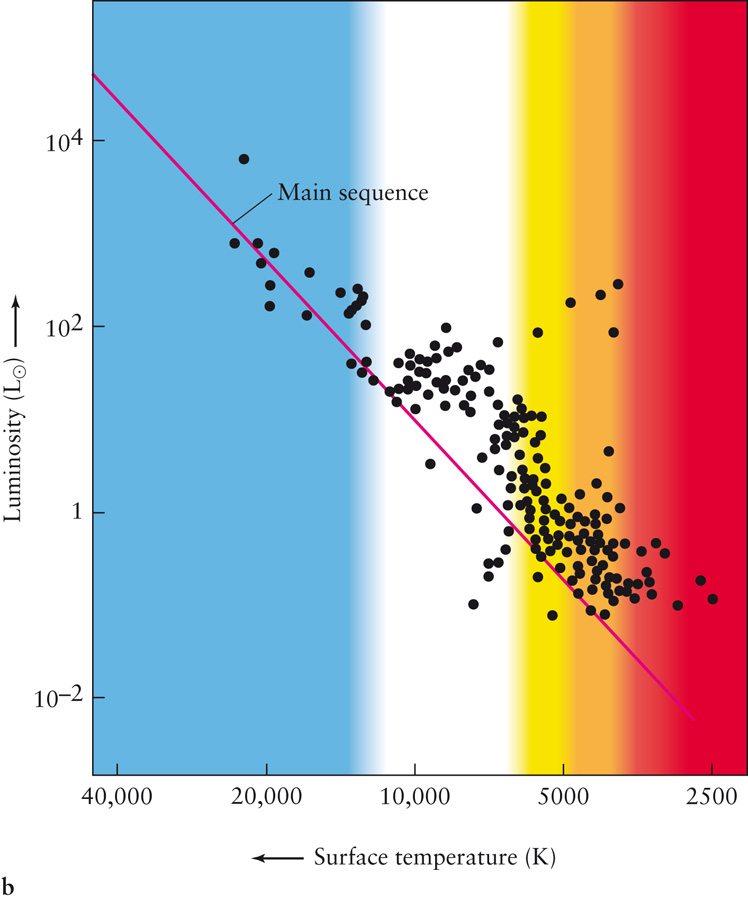
| Description: Plotting the Ages of Stars (b) Each dot plotted on this H-R diagram represents a star in this cluster whose luminosity and surface temperature have been measured. Note that most of the cool, low-mass stars have not yet arrived at the main sequence. Calculations of stellar evolution indicate that this star cluster started forming about 2 million years ago Picture Stats: Views: 610 Filesize: 134.09kB Height: 900 Width: 748 Source: https://biology-forums.com/index.php?action=gallery;sa=view;id=18422 |