 |
| Previous Image | Next Image |
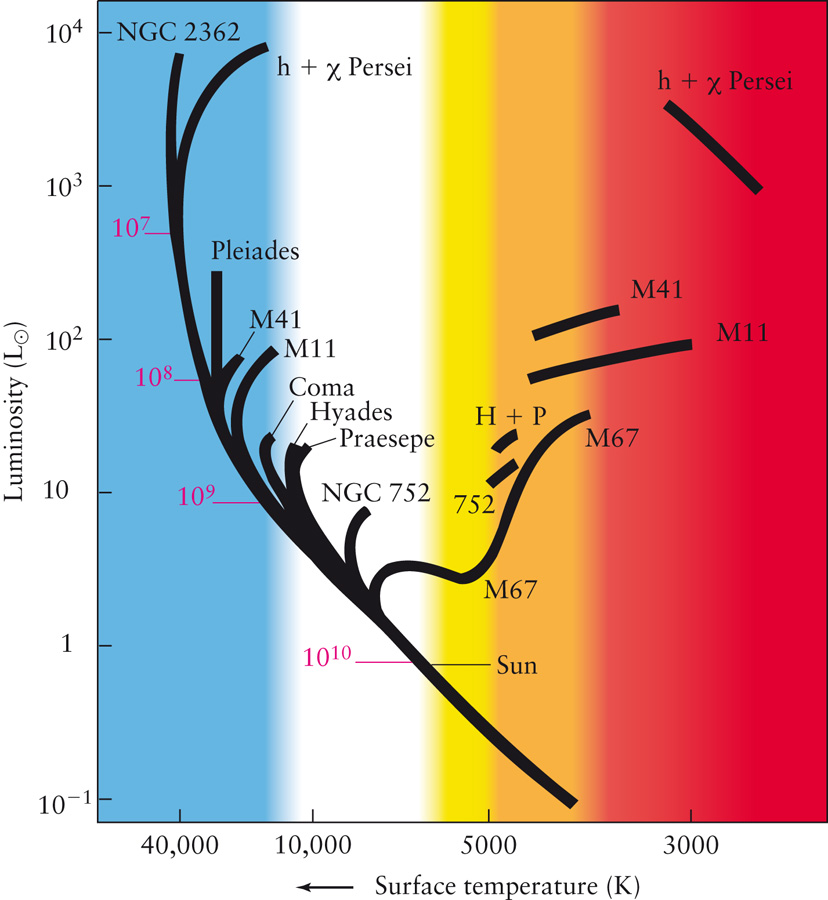
| Description: Structure of the H-R Diagram (b) The black bands indicate where data from various star clusters fall on the H-R diagram. The ages of turnoff points (in years) are listed in red alongside the main sequence. The age of a cluster can be estimated from the location of the turnoff point, where the cluster’s most massive stars are just now leaving the main sequence. Picture Stats: Views: 702 Filesize: 165.84kB Height: 900 Width: 828 Source: https://biology-forums.com/index.php?action=gallery;sa=view;id=18437 |