 |
| Previous Image | Next Image |
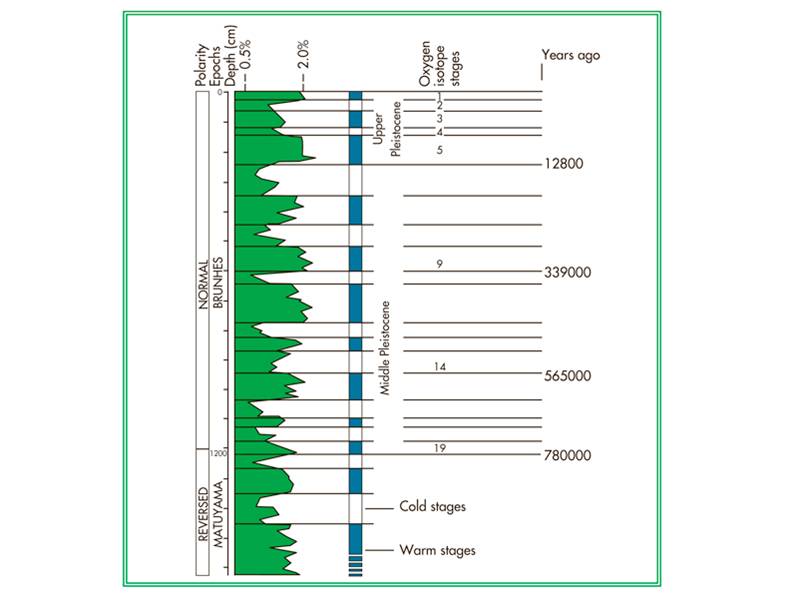
| Description: The oxygen isotope curve illustrates the ratio between 16O and 18O.
Picture Stats: Views: 733 Filesize: 41.51kB Height: 601 Width: 800 Source: https://biology-forums.com/index.php?action=gallery;sa=view;id=20581 |
