 |
| Previous Image | Next Image |
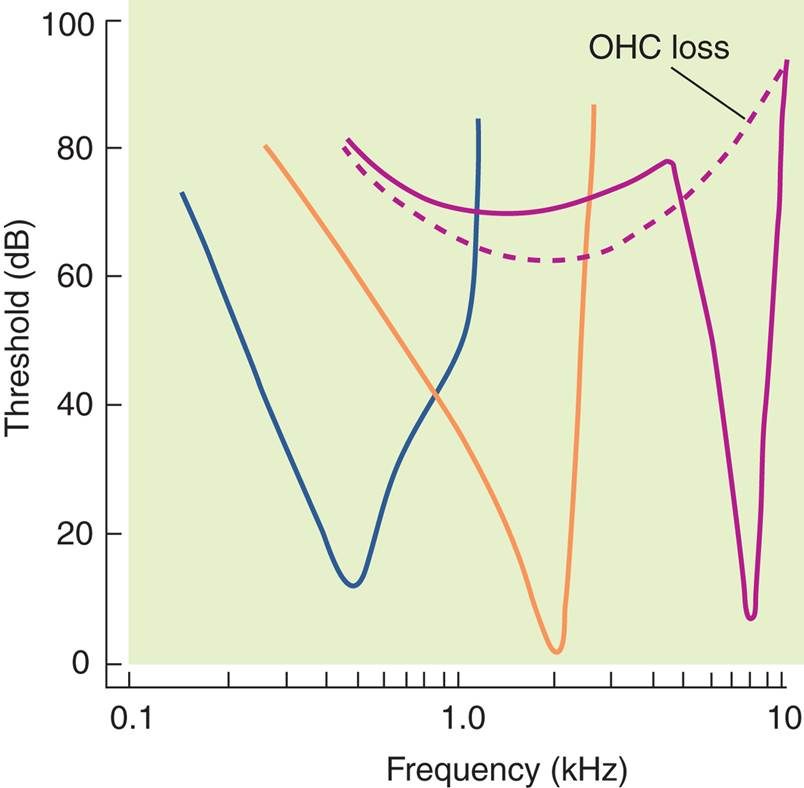
| Description: The figure shows the responses of single axons in the cochlear nerve that receive information from inner hair cells on different locations of the basilar membrane. The cells are more frequency selective at lower sound intensities. The dashed line shows the loss of sensitivity and selectivity of the high-frequency neuron after destruction of the outer hair cells. (Adapted from Fettiplace, R., and Hackney, C. M. Nature Reviews: Neuroscience, 2006, 7, 19–29.)
Picture Stats: Views: 539 Filesize: 41.03kB Height: 788 Width: 804 Source: https://biology-forums.com/index.php?action=gallery;sa=view;id=21384 |