 |
| Previous Image | Next Image |
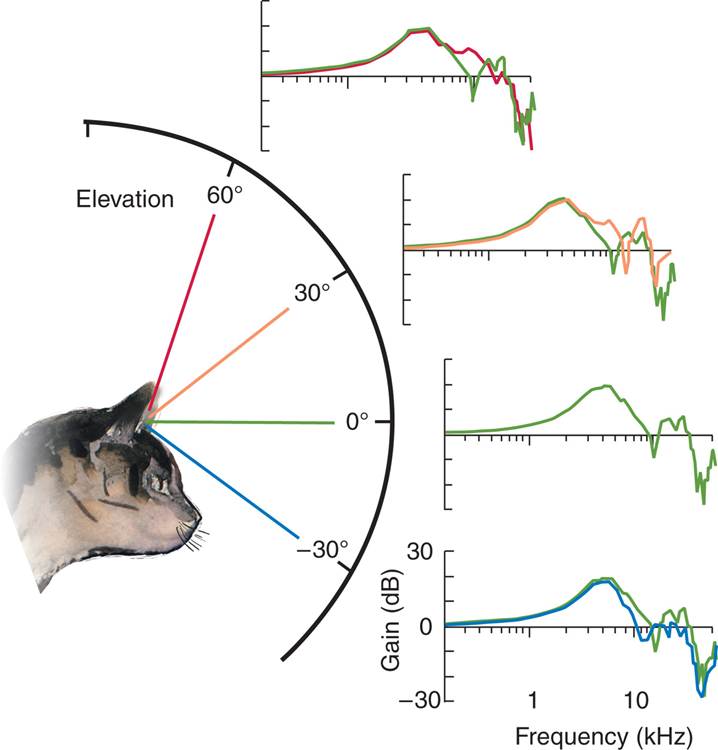
| Description: The graphs are transfer functions, which compare the intensity of various frequencies of sound received by the ear to the intensity of these frequencies received by a microphone in open air. For ease of comparison, the 0° transfer function (green) is superimposed on the transfer functions obtained at 60° (red), 30° (orange), and –30° (blue). The differences in the transfer functions at various elevations provide cues that aid in perception of the location of a sound source. (Adapted from Oertel, D., and Young, E. D. Trends in Neuroscience, 2004, 27, 104–110.)
Picture Stats: Views: 1321 Filesize: 39.9kB Height: 750 Width: 718 Source: https://biology-forums.com/index.php?action=gallery;sa=view;id=21389 |