 |
| Previous Image | Next Image |
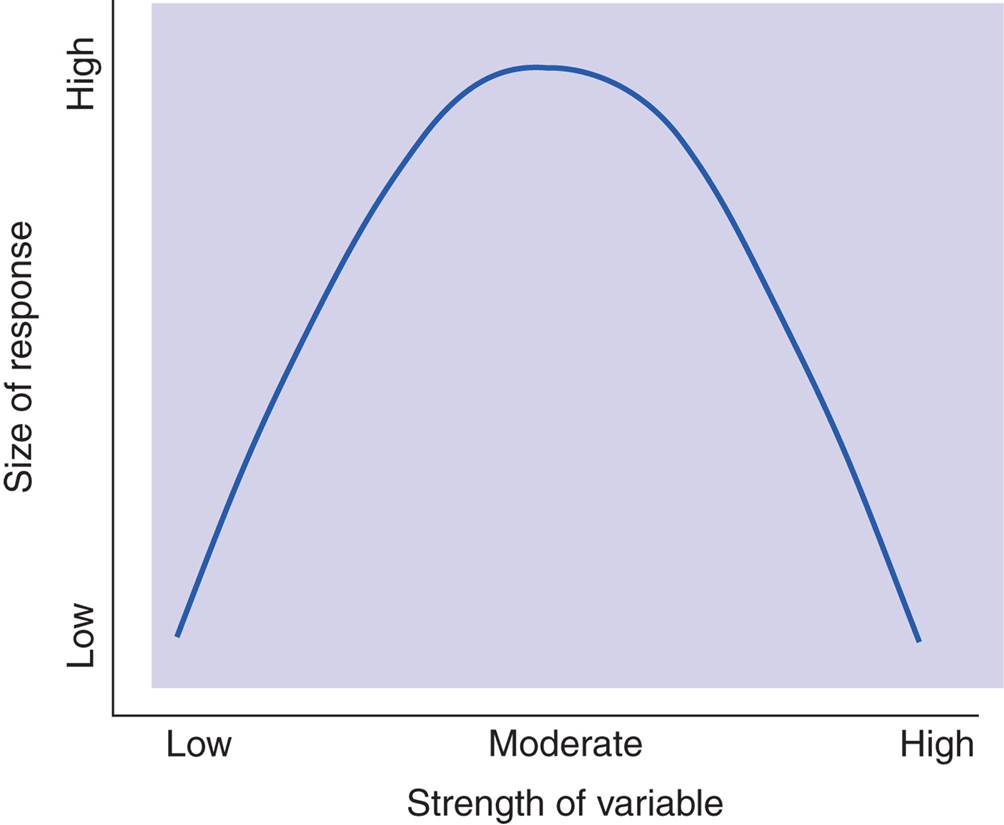
| Description: The graph illustrates an inverted U-curve function, in which low and high values of the variable on the horizontal axis are associated with low values of the variable on the vertical axis and moderate values are associated with high values. Presumably, the relationship between brain dopamine levels and the symptoms of ADHD follow a function like this one.
Picture Stats: Views: 747 Filesize: 35.47kB Height: 825 Width: 1004 Source: https://biology-forums.com/index.php?action=gallery;sa=view;id=21761 |