 |
| Previous Image | Next Image |
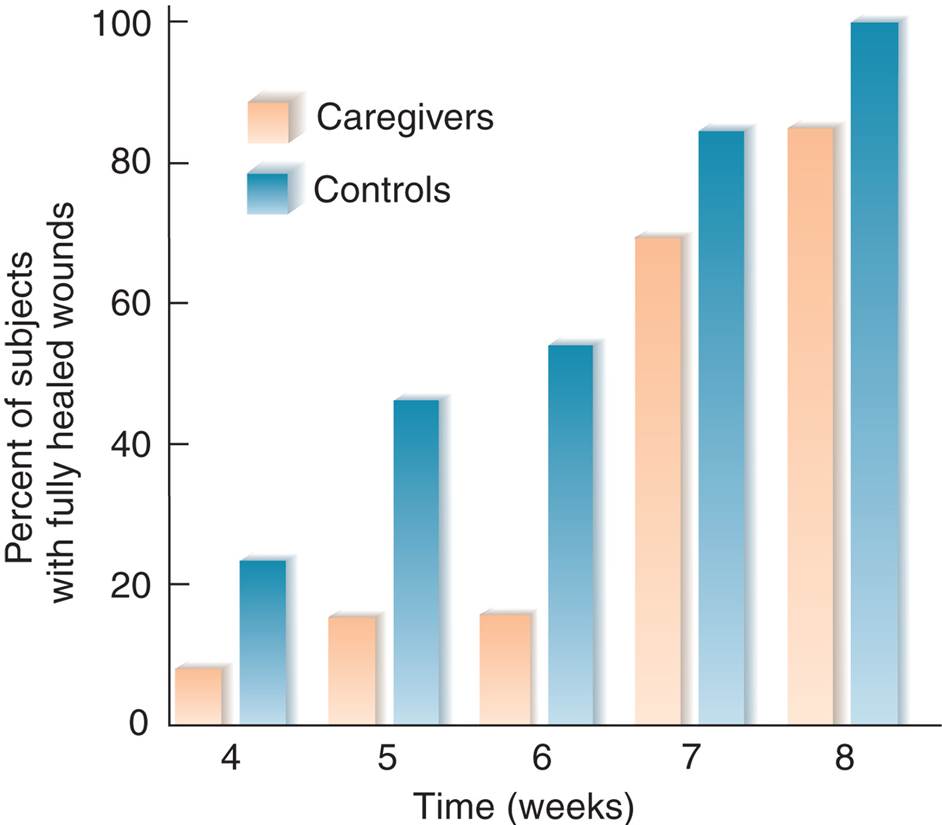
| Description: The graph shows the percentage of caregivers and control subjects whose wounds had healed as a function of time after the biopsy was performed. (Based on data from Kiecolt-Glaser et al., 1995.)
Picture Stats: Views: 850 Filesize: 45.9kB Height: 825 Width: 942 Source: https://biology-forums.com/index.php?action=gallery;sa=view;id=21765 |