 |
| Previous Image | Next Image |
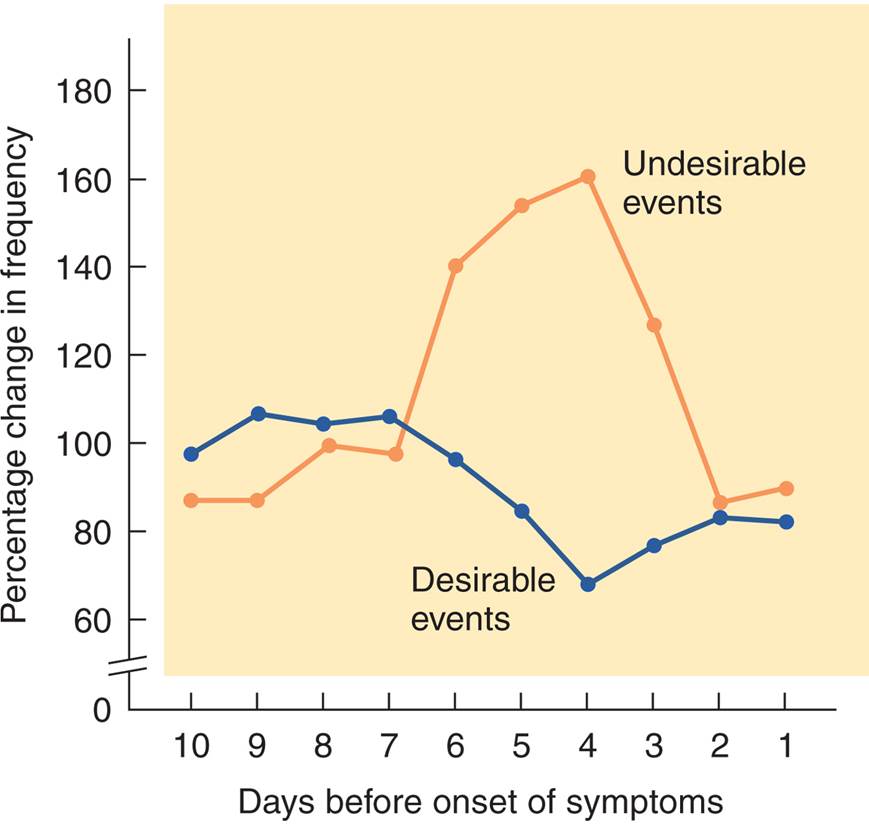
| Description: The graph shows mean percentage change in frequency of undesirable and desirable events during the ten-day period preceding the onset of symptoms of upper respiratory infections. (Based on data from Stone et al., 1987.)
Picture Stats: Views: 893 Filesize: 46kB Height: 825 Width: 869 Source: https://biology-forums.com/index.php?action=gallery;sa=view;id=21777 |