 |
| Previous Image | Next Image |
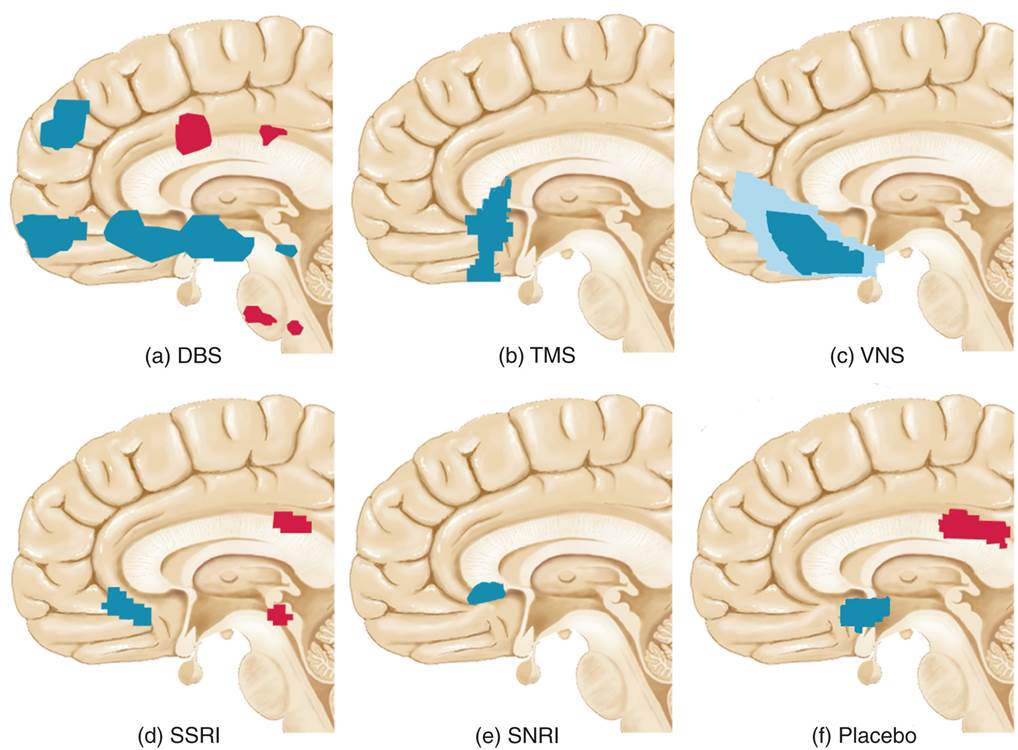
| Description: The figure shows a standard drawing of an anterior midsagittal view of the human brain with tracings of regions of increased (red) or decreased (blue) activation seen in functional imaging studies of brain responses to successful treatment for the symptoms of depression. Treatment with (a) DBS, (b) TMS, (c) VNS, (d) SSRI, (e) SNRI, (f) placebo. [Tracings of brain activity from (a) Mayberg et al. (2005), (b) Kito et al. (2011), (c) Pardo et al. (2008), (d) Mayberg et al. (2002), (e) Kennedy et al. (2007), (f) Mayberg et al. (2002).]
Picture Stats: Views: 625 Filesize: 76.47kB Height: 750 Width: 1018 Source: https://biology-forums.com/index.php?action=gallery;sa=view;id=21805 |