 |
| Previous Image | Next Image |
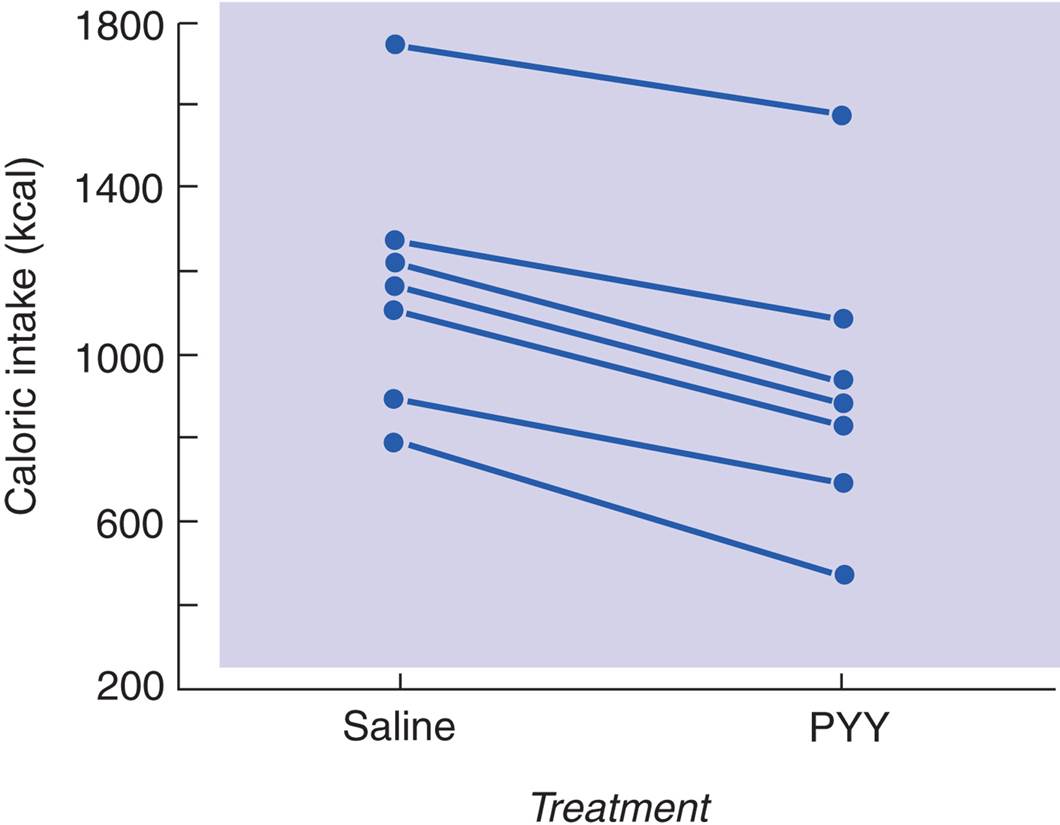
| Description: The graph shows the amount of food (in kilocalories) eaten at a buffet meal thirty minutes after people received a ninety-minute intravenous infusion of saline or PYY. Data points from each subject are connected by straight lines. (Data from Batterham, R. L., ffytche, D. H., Rosenthal, J. M., et al. Nature, 2007, 450, 106–109.)
Picture Stats: Views: 538 Filesize: 47.2kB Height: 825 Width: 1060 Source: https://biology-forums.com/index.php?action=gallery;sa=view;id=21858 |