 |
| Previous Image | Next Image |
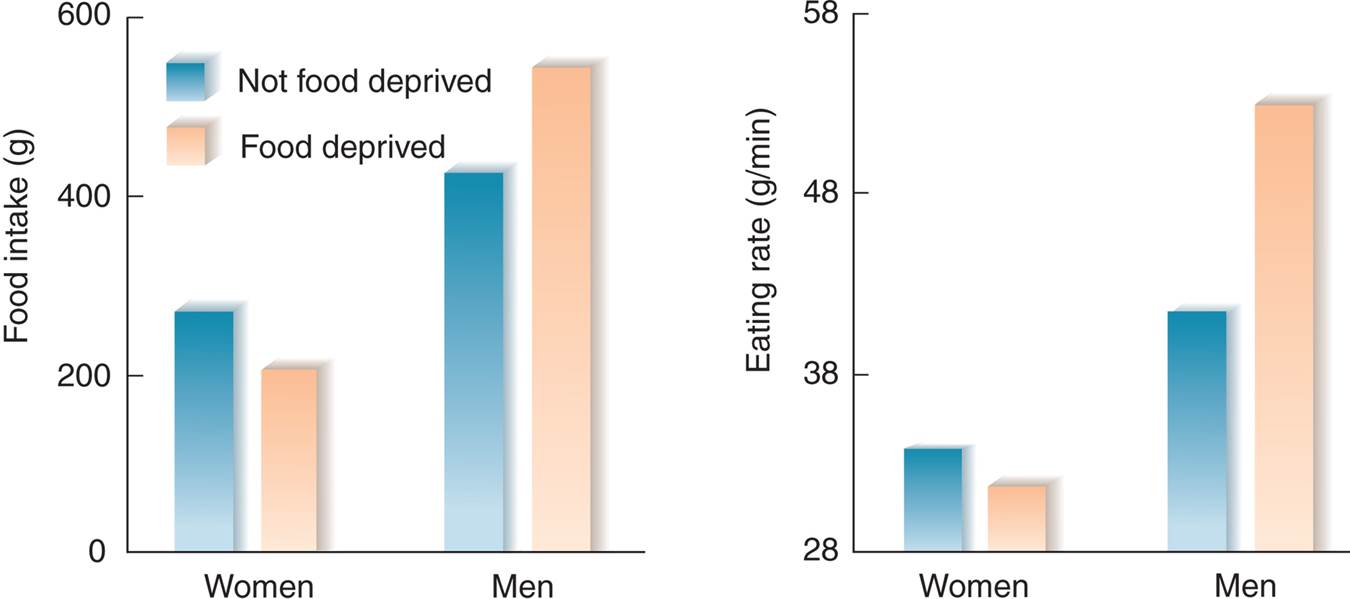
| Description: The graph shows food intake and eating rate during a buffet lunch after a 24-hour period of fasting or after a period during which they ate meals at their normal times. (Data from Södersten, P., Bergh, C., and Zandian, M. Hormones and Behavior, 2006, 50, 572–578.)
Picture Stats: Views: 644 Filesize: 44.73kB Height: 599 Width: 1350 Source: https://biology-forums.com/index.php?action=gallery;sa=view;id=21877 |