 |
| Previous Image | Next Image |
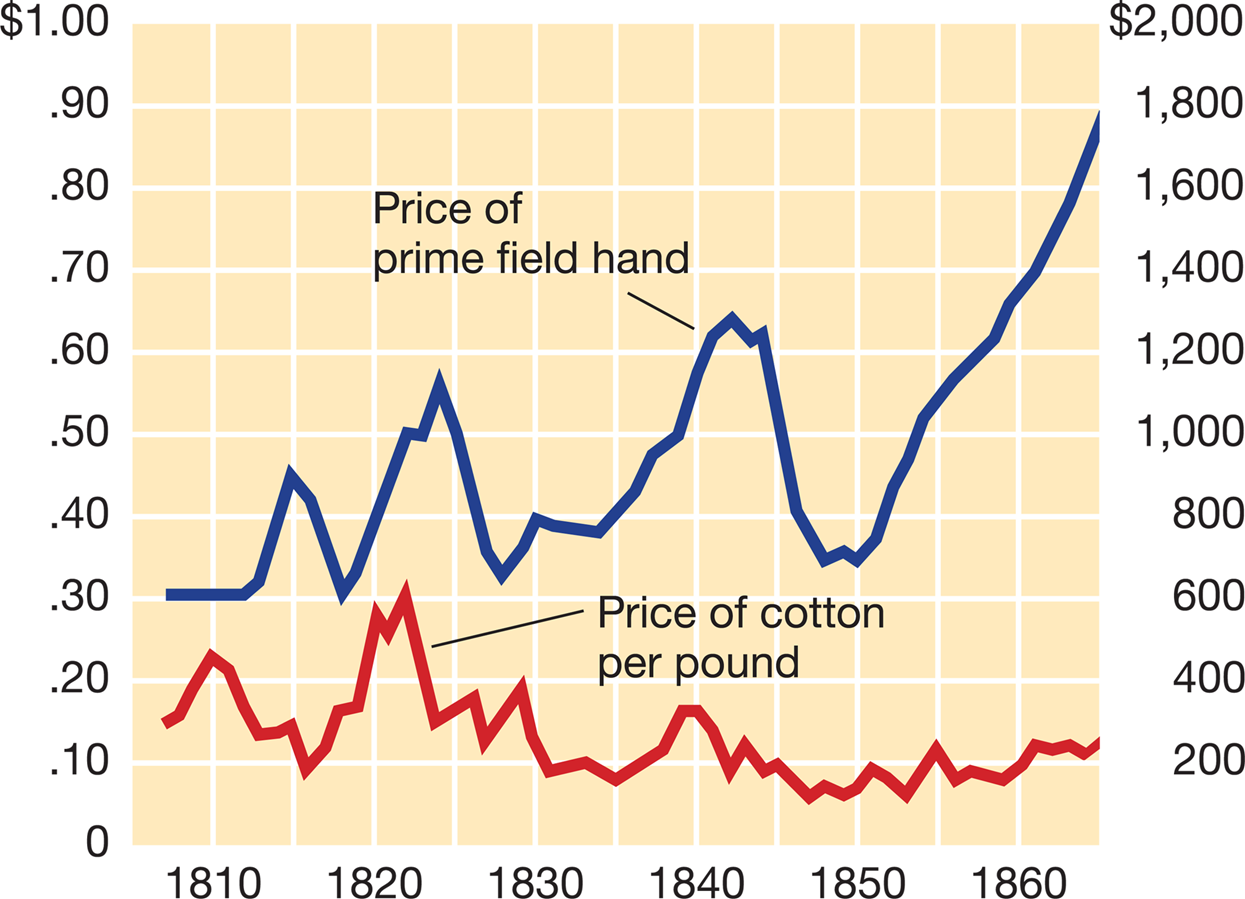
| Description: These prices for cotton and field slaves appear in New Orleans records. The left axis shows the price of cotton; the right, the price of a slave. The rising trend of slave prices (especially from 1850 to 1860), and a growing slave population, show the continuing profitability and viability of slavery up to 1860. Picture Stats: Views: 1034 Filesize: 239.33kB Height: 899 Width: 1245 Source: https://biology-forums.com/index.php?action=gallery;sa=view;id=22283 |