 |
| Previous Image | Next Image |
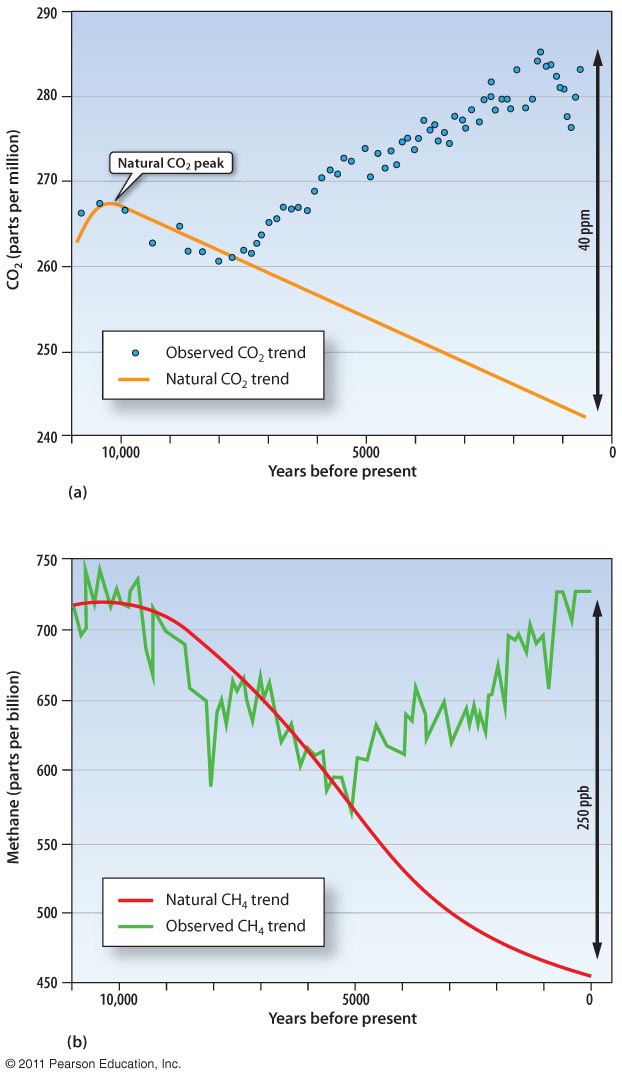
| Description: The curves represent the concentrations of atmospheric CO2 (a) and methane (CH4) (b) as determined from ice cores. Note the shift from the longer-term natural trends at about 7000 years ago for CO2 and at 5000 years ago for methane. Could this be related to an increase in farming practices? If data for the last 200 years were included, the CO2 concentration would go off the chart—CO2 concentrations increased to 380 ppm during this time! Picture Stats: Views: 650 Filesize: 110.3kB Height: 1080 Width: 622 Source: https://biology-forums.com/index.php?action=gallery;sa=view;id=22527 |
