 |
| Previous Image | Next Image |
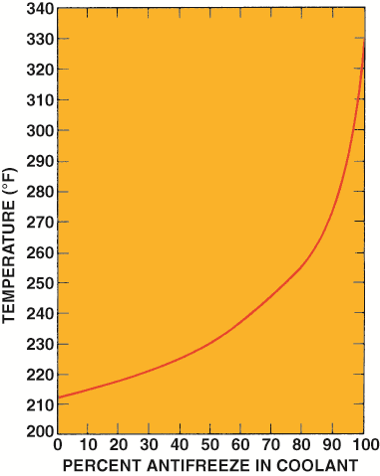
| Description: Graph showing how the boiling point of the coolant increases as the percentage of antifreeze in the coolant increases.
Picture Stats: Views: 474 Filesize: 62.63kB Height: 476 Width: 380 Source: https://biology-forums.com/index.php?action=gallery;sa=view;id=29567 |
