 |
| Previous Image | Next Image |
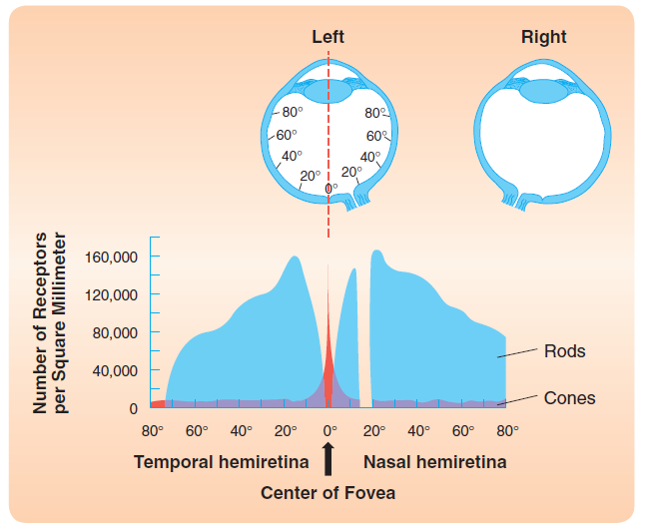
| Description: The distribution of cones and rods over the human retina. The figure illustrates the number of cones and rods per square millimeter as a function of distance from the center of the fovea. (Based on Lindsay & Norman, 1977.)
Picture Stats: Views: 444 Filesize: 126.33kB Height: 528 Width: 645 Source: https://biology-forums.com/index.php?action=gallery;sa=view;id=30293 |
