 |
| Previous Image | Next Image |
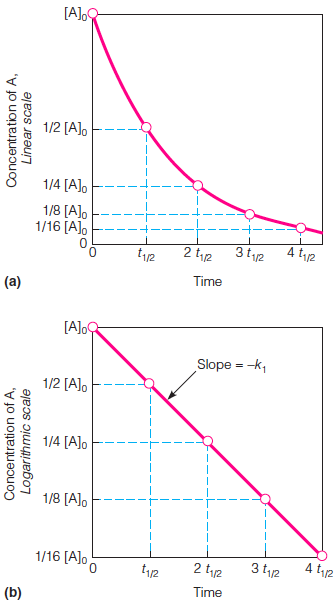
| Description: Graphs (a) and (b) analyze the rate of a single reaction, with time expressed as multiples of the half-life (t1/2) of the reactant. Note that for each interval of t1/2 the reactant concentration is halved. a. A graph of [A] versus t shows that the rate, defined as the slope of the curve, decreases as the reaction continues. b. A graph of ln[A] versus t, when linear, indicates that the reaction follows the equation [A]t = [A]oe-kt and is first-order. The slope of this line (d ln[A]/dt) is equal to -k1. Picture Stats: Views: 534 Filesize: 33.39kB Height: 605 Width: 336 Source: https://biology-forums.com/index.php?action=gallery;sa=view;id=34361 |
