 |
| Previous Image | Next Image |
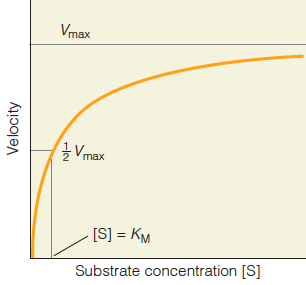
| Description: This graph shows the variation of reaction velocity with substrate concentration according to the Michaelis–Menten model of enzyme kinetics. The values of v plotted here are determined from the initial rates of the reaction. At the point where Note that Vmax is approached asymptotically. Picture Stats: Views: 411 Filesize: 12.5kB Height: 285 Width: 306 Source: https://biology-forums.com/index.php?action=gallery;sa=view;id=34384 |
