 |
| Previous Image | Next Image |
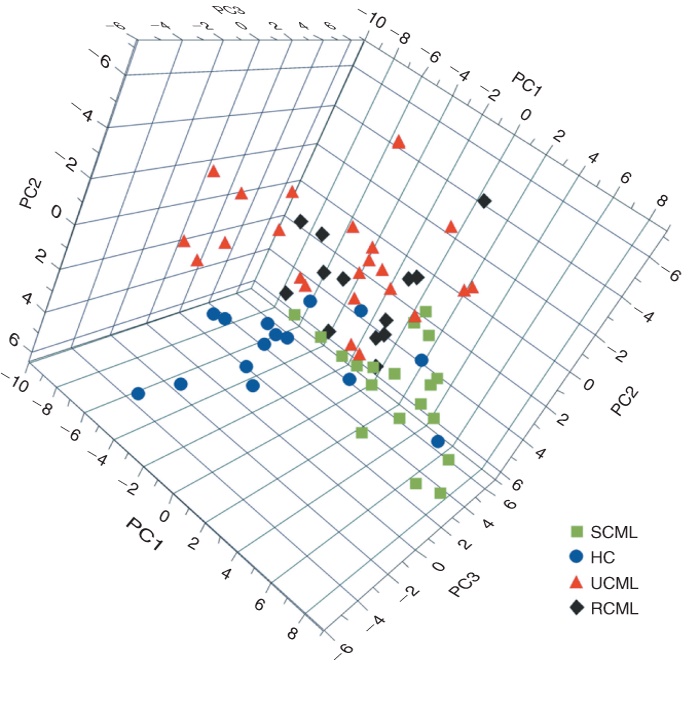
| Description: 3D scatter plot of the first three principal components (PC1 vs. PC2 vs. PC3). Green squares are patients who are sensitive to drug treatment (SCML). Black diamonds are patients who are resistant to drug treatment (RCML). Red triangles are untreated CML patients (UCML). Blue circles are healthy controls (HC). Picture Stats: Views: 458 Filesize: 366.6kB Height: 710 Width: 700 Source: https://biology-forums.com/index.php?action=gallery;sa=view;id=34475 |
