 |
| Previous Image | Next Image |
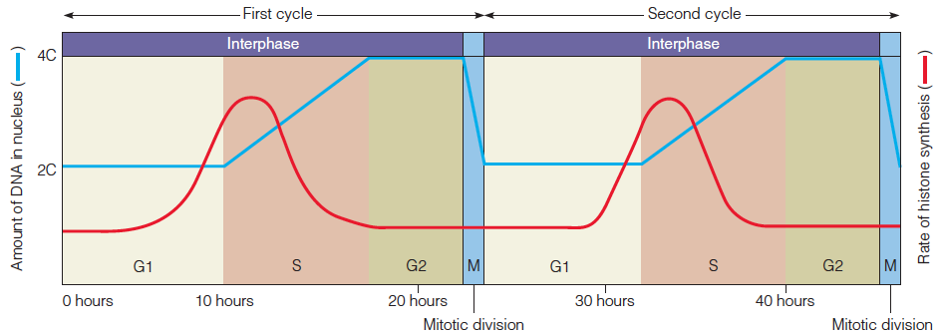
| Description: Changes in the amount of DNA (blue line) and rate of histone synthesis (red line) with time during two cell cycles. The DNA content is measured in units of the haploid genome (C). The time scale is typical of many eukaryotic cells. Picture Stats: Views: 375 Filesize: 84.97kB Height: 334 Width: 944 Source: https://biology-forums.com/index.php?action=gallery;sa=view;id=34920 |
