 |
| Previous Image | Next Image |
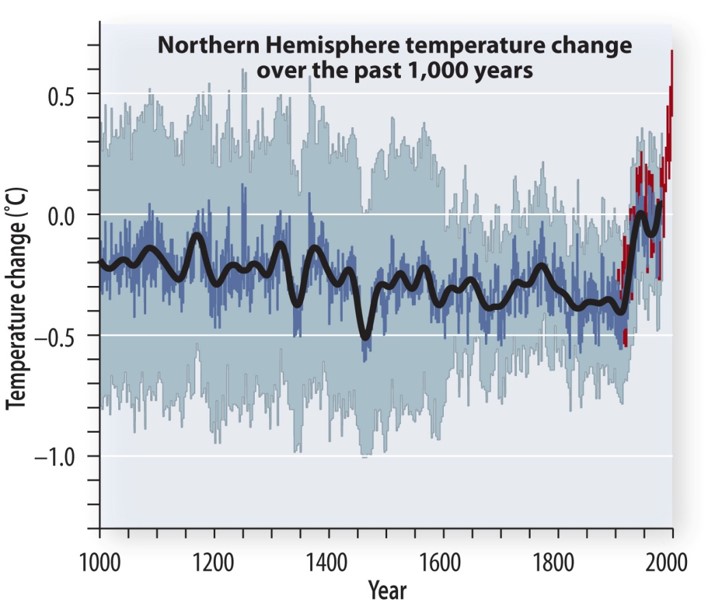
| Description: This graph shows temperature change over the past 1,000 years compared to a 1961–1990 average. Picture Stats: Views: 379 Filesize: 76.82kB Height: 600 Width: 715 Source: https://biology-forums.com/index.php?action=gallery;sa=view;id=36226 |