 |
| Previous Image | Next Image |
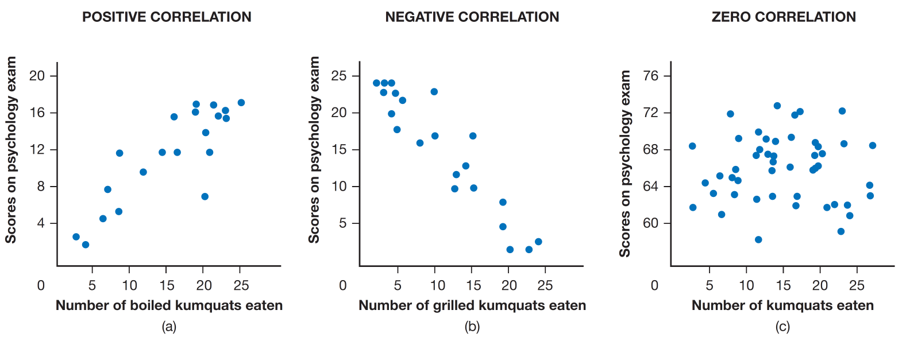
| Description: Graph (a) shows a positive correlation between scores on a psychology test and number of boiled kumquats eaten per month: The higher the score, the higher the number of kumquats. Graph (b) shows a negative correlation between test scores and number of grilled kumquats eaten: The higher the scores, the lower the number of kumquats. Graph (c) shows the reality—a zero correlation between kumquat-eating and test scores. Picture Stats: Views: 177 Filesize: 87.17kB Height: 341 Width: 906 Source: https://biology-forums.com/index.php?action=gallery;sa=view;id=39010 |