 |
| Previous Image | Next Image |
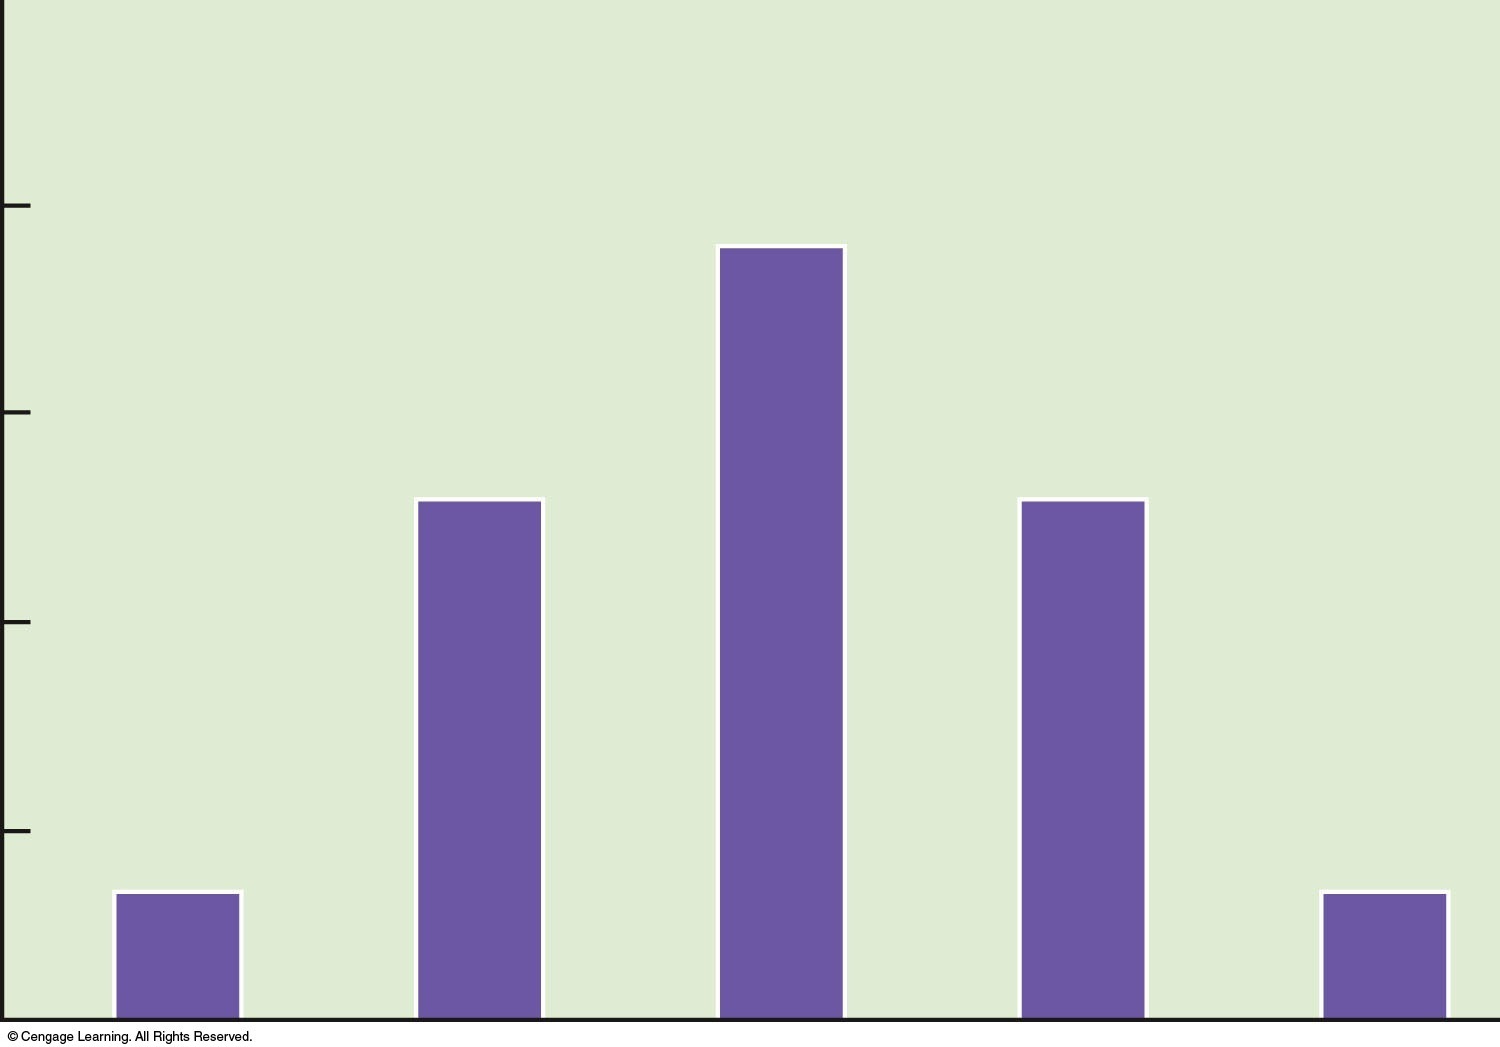
| Description: Frequency distribution of phenotypes from the possible offspring in Figure 5.7. Height of the offspring shows regression to the mean. Picture Stats: Views: 281 Filesize: 59.56kB Height: 1047 Width: 1500 Source: https://biology-forums.com/index.php?action=gallery;sa=view;id=44179 |
