 |
| Previous Image | Next Image |
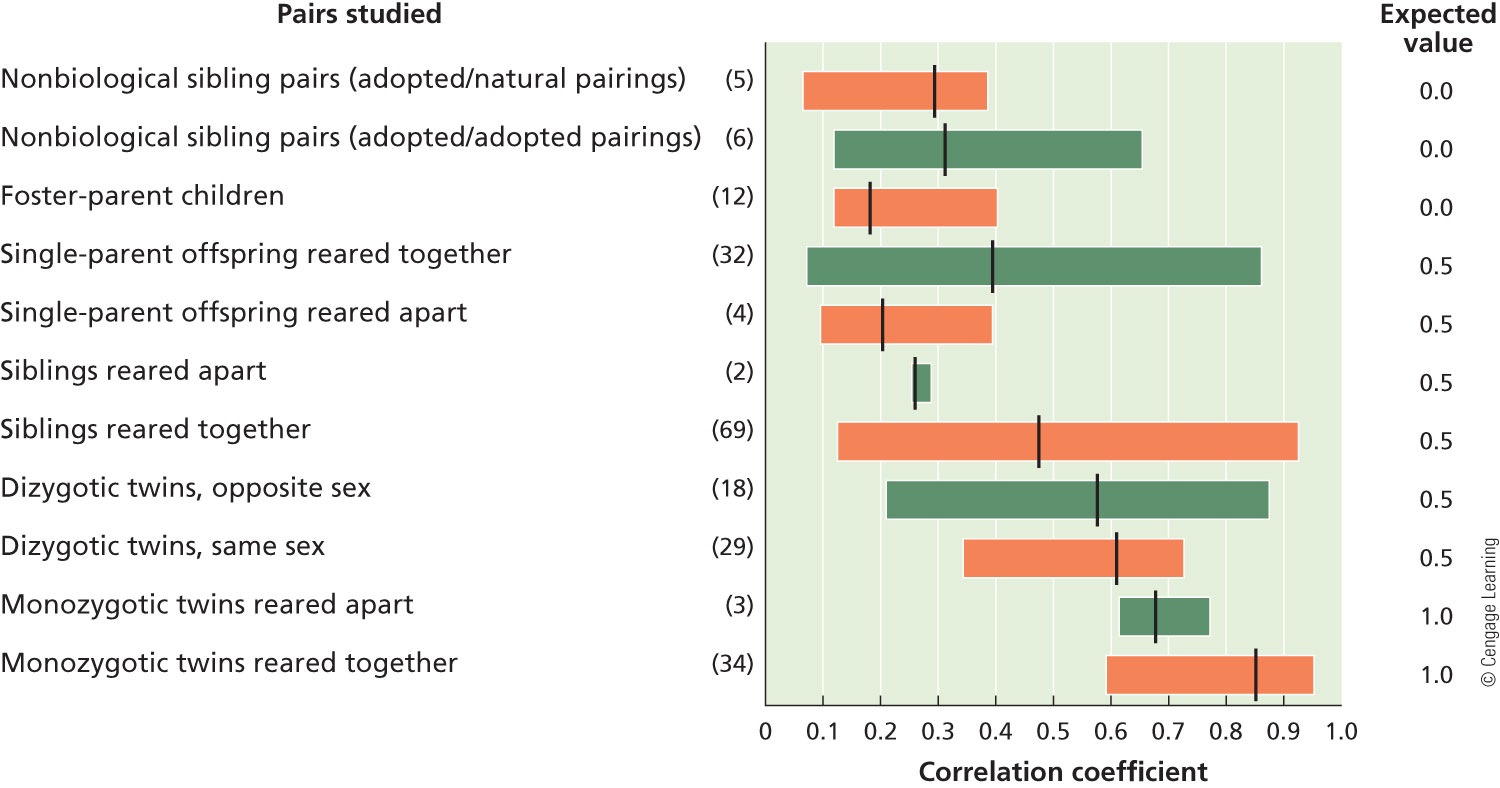
| Description: A graphical representation of correlations in IQ measurements in different sets of individuals. The expected correlation coefficients are determined by the degree of genetic relatedness in each set of individuals. The vertical line represents the median correlation coefficient in each case. Pairs studied Nonbiological sibling pairs (adopted/natural pairings) (5) Nonbiological sibling pairs (adopted/adopted pairings) (6) Foster-parent children (12) Single-parent offspring reared together (32) Single-parent offspring reared apart (4) Siblings reared apart (2) Siblings reared together (69) Dizygotic twins, opposite sex (18) Dizygotic twins, same sex (29) Monozygotic twins reared apart (3) Monozygotic twins reared together (34) 0.2 0.3 0.4 0.5 0.6 0.7 0.8 0.9 Correlation coefficient Picture Stats: Views: 230 Filesize: 170.29kB Height: 788 Width: 1500 Source: https://biology-forums.com/index.php?action=gallery;sa=view;id=44193 |
