 |
| Previous Image | Next Image |
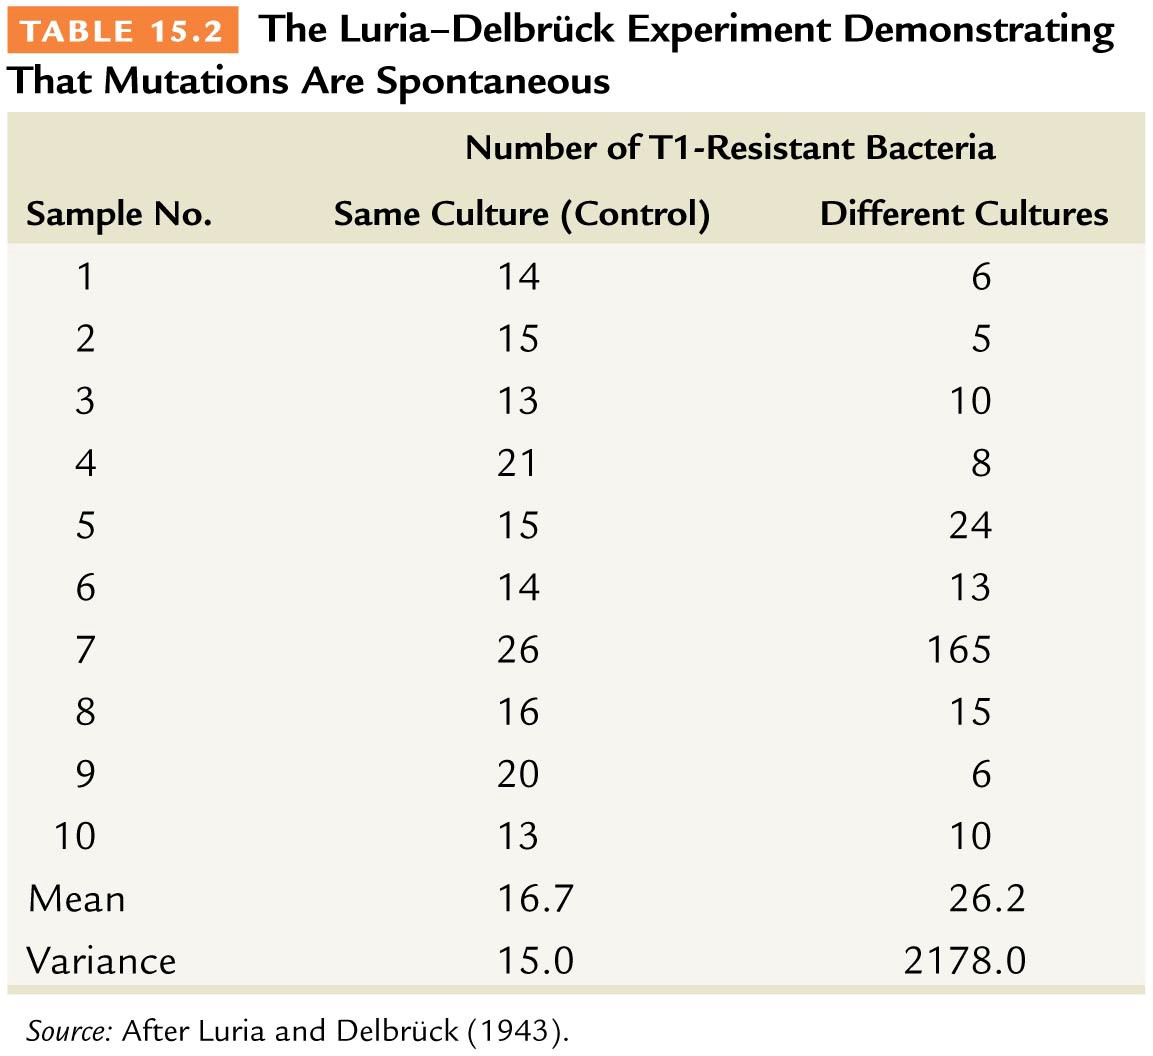
| Description: TABLE 15.2 The Luria—Delbrfick Experiment Demonstrating That Mutations Are Spontaneous Number of T1 -Resistant Bacteria Sample No. Same Culture (Control) Different Cultures 1 14 6 2 15 5 3 13 1O 4 21 8 5 15 24 6 14 13 7 26 165 8 16 15 9 20 6 1O 13 10 Mean 16.7 26.2 Variance 15.0 2178.0 Source: After Luria and DelerCk (1943).
Picture Stats: Views: 179 Filesize: 108.92kB Height: 1056 Width: 1153 Source: https://biology-forums.com/index.php?action=gallery;sa=view;id=44518 |
