 |
| Previous Image | Next Image |
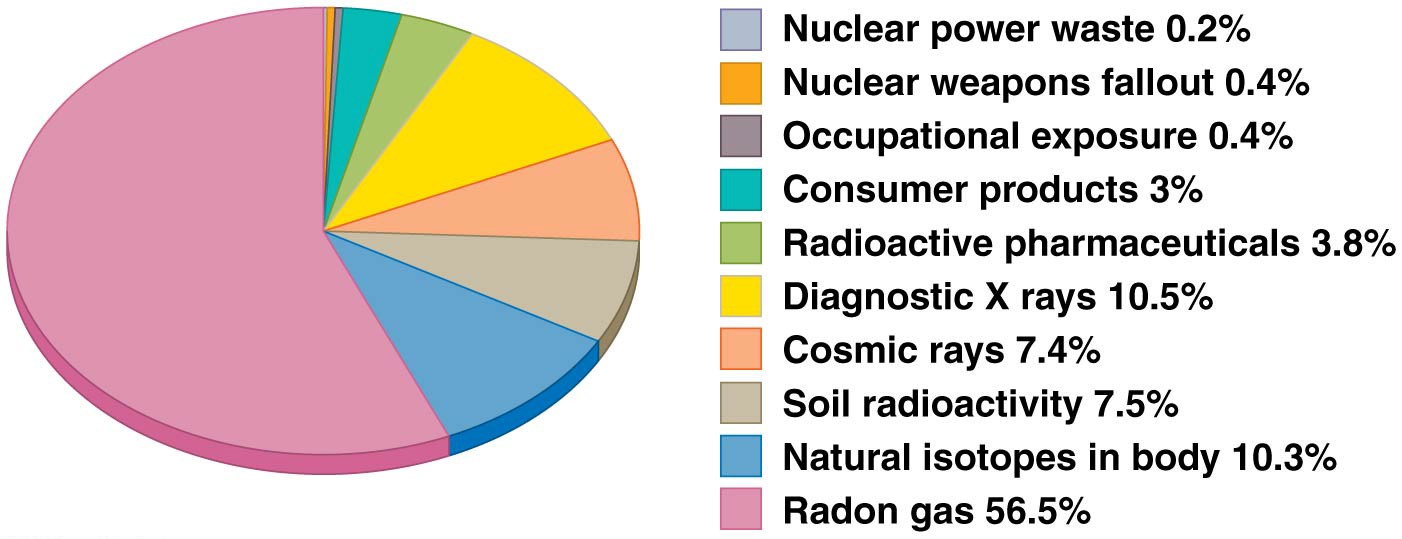
| Description: Nuclear power waste 0.2% I Nuclear weapons fallout 0.4% Occupational exposure 0.4% I Consumer products 3% I Radioactive pharmaceuticals 3.8% I Diagnostic X rays 10.5% I Cosmic rays 7.4% Soil radioactivity 7.5% I Natural isotopes in body 10.3% . Radon gas 56.5%
Picture Stats: Views: 225 Filesize: 113.12kB Height: 539 Width: 1402 Source: https://biology-forums.com/index.php?action=gallery;sa=view;id=44612 |
