 |
| Previous Image | Next Image |
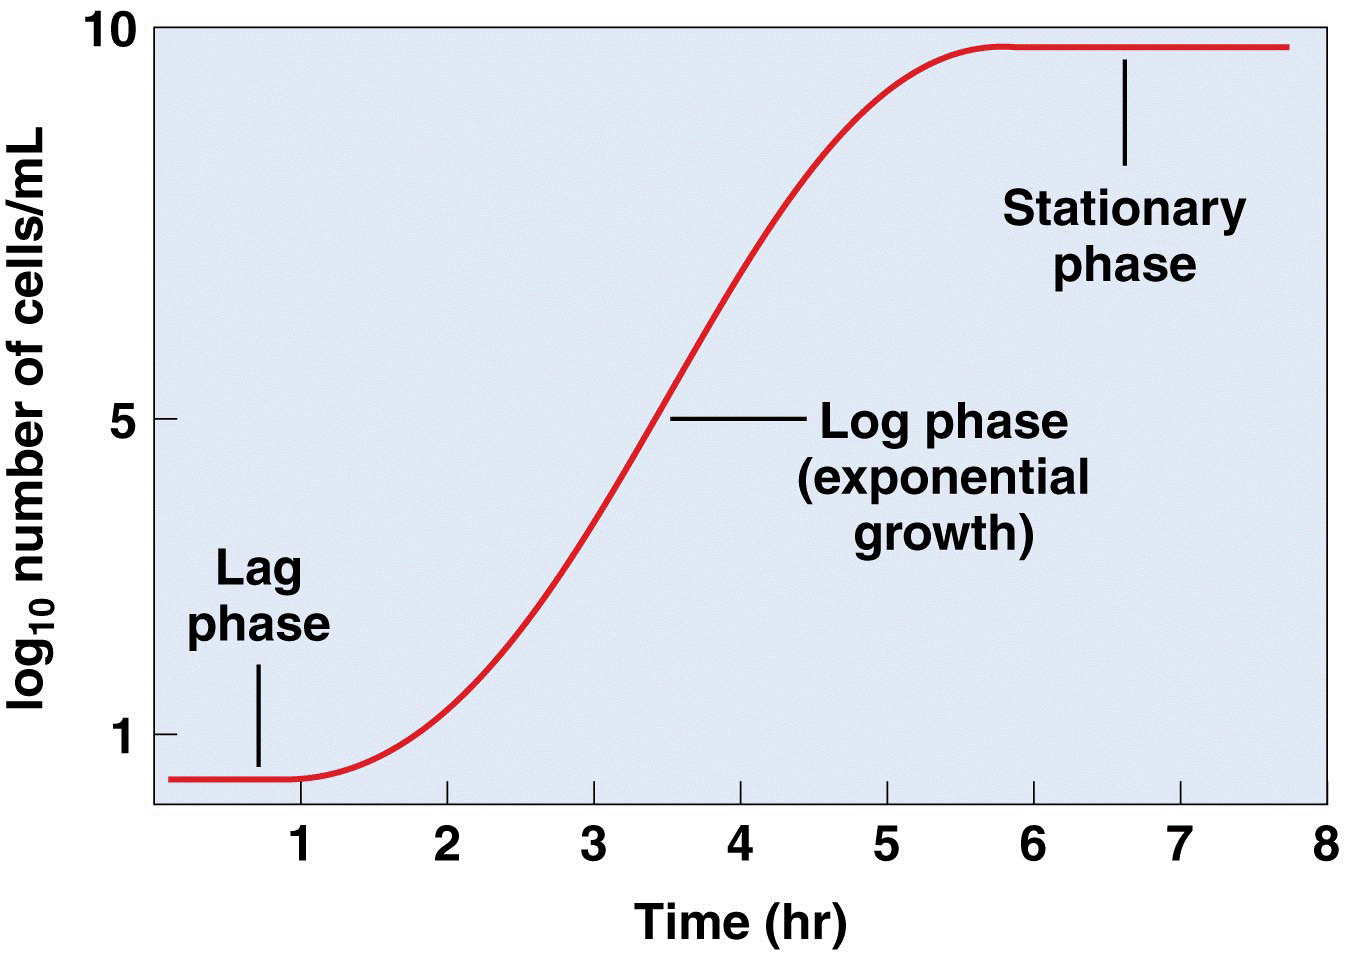
| Description: Typical bacterial population growth curve showing the initial lag phase, the subsequent log phase where exponential growth occurs, and the stationary phase that occurs when nutrients are exhausted.
Picture Stats: Views: 193 Filesize: 316.9kB Height: 958 Width: 1349 Source: https://biology-forums.com/index.php?action=gallery;sa=view;id=46723 |
