 |
| Previous Image | Next Image |
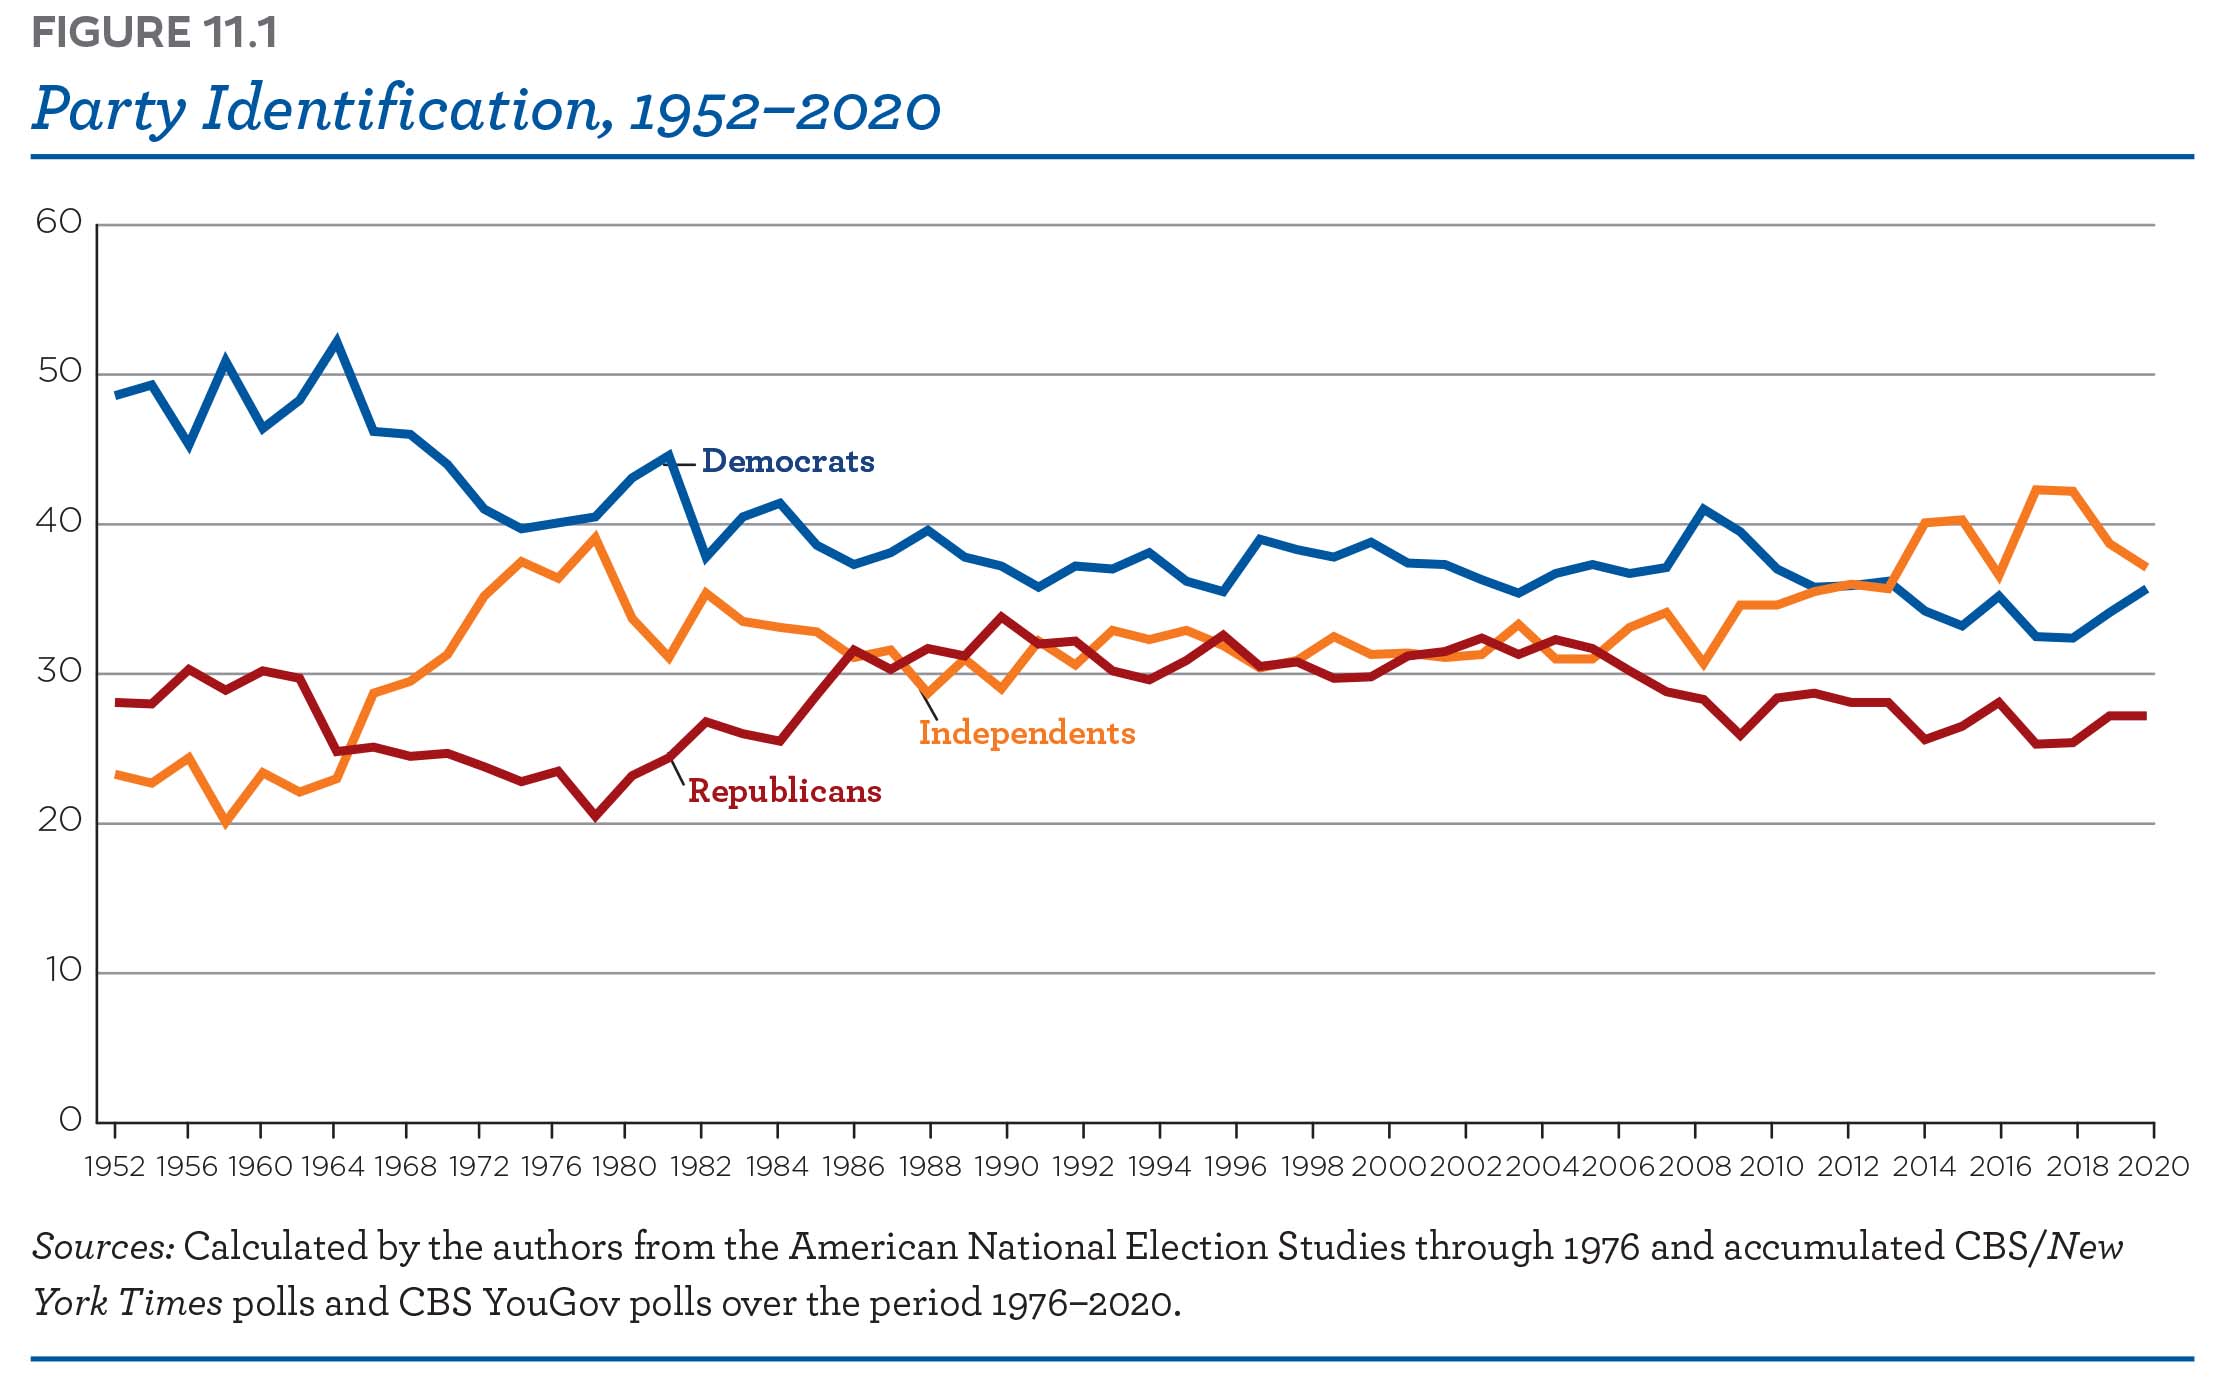
| Description: FIGURE 11.1 Party Identification, 1952-2020 60 50 A Democrats 30 ‘-V-9 " .7 "‘ Independents Republicans 20 10 O I I | I I I I I I I I I I I I I I I I I I I I I I I I 1952 1956196019641968 1972 19761980 1982 1984 1986 1988 1990 1992 1994 1996 1998 2000200220042006200 8 2010 2012 2014 2016 2018 2020 Sources: Calculated by the authors from the American National Election Studies through 1976 and accumulated CBS/New York Times polls and CBS YouGov polls over the period 1976—2020.
Picture Stats: Views: 756 Filesize: 225.09kB Height: 1379 Width: 2227 Source: https://biology-forums.com/index.php?action=gallery;sa=view;id=46794 |
