 |
| Previous Image | Next Image |
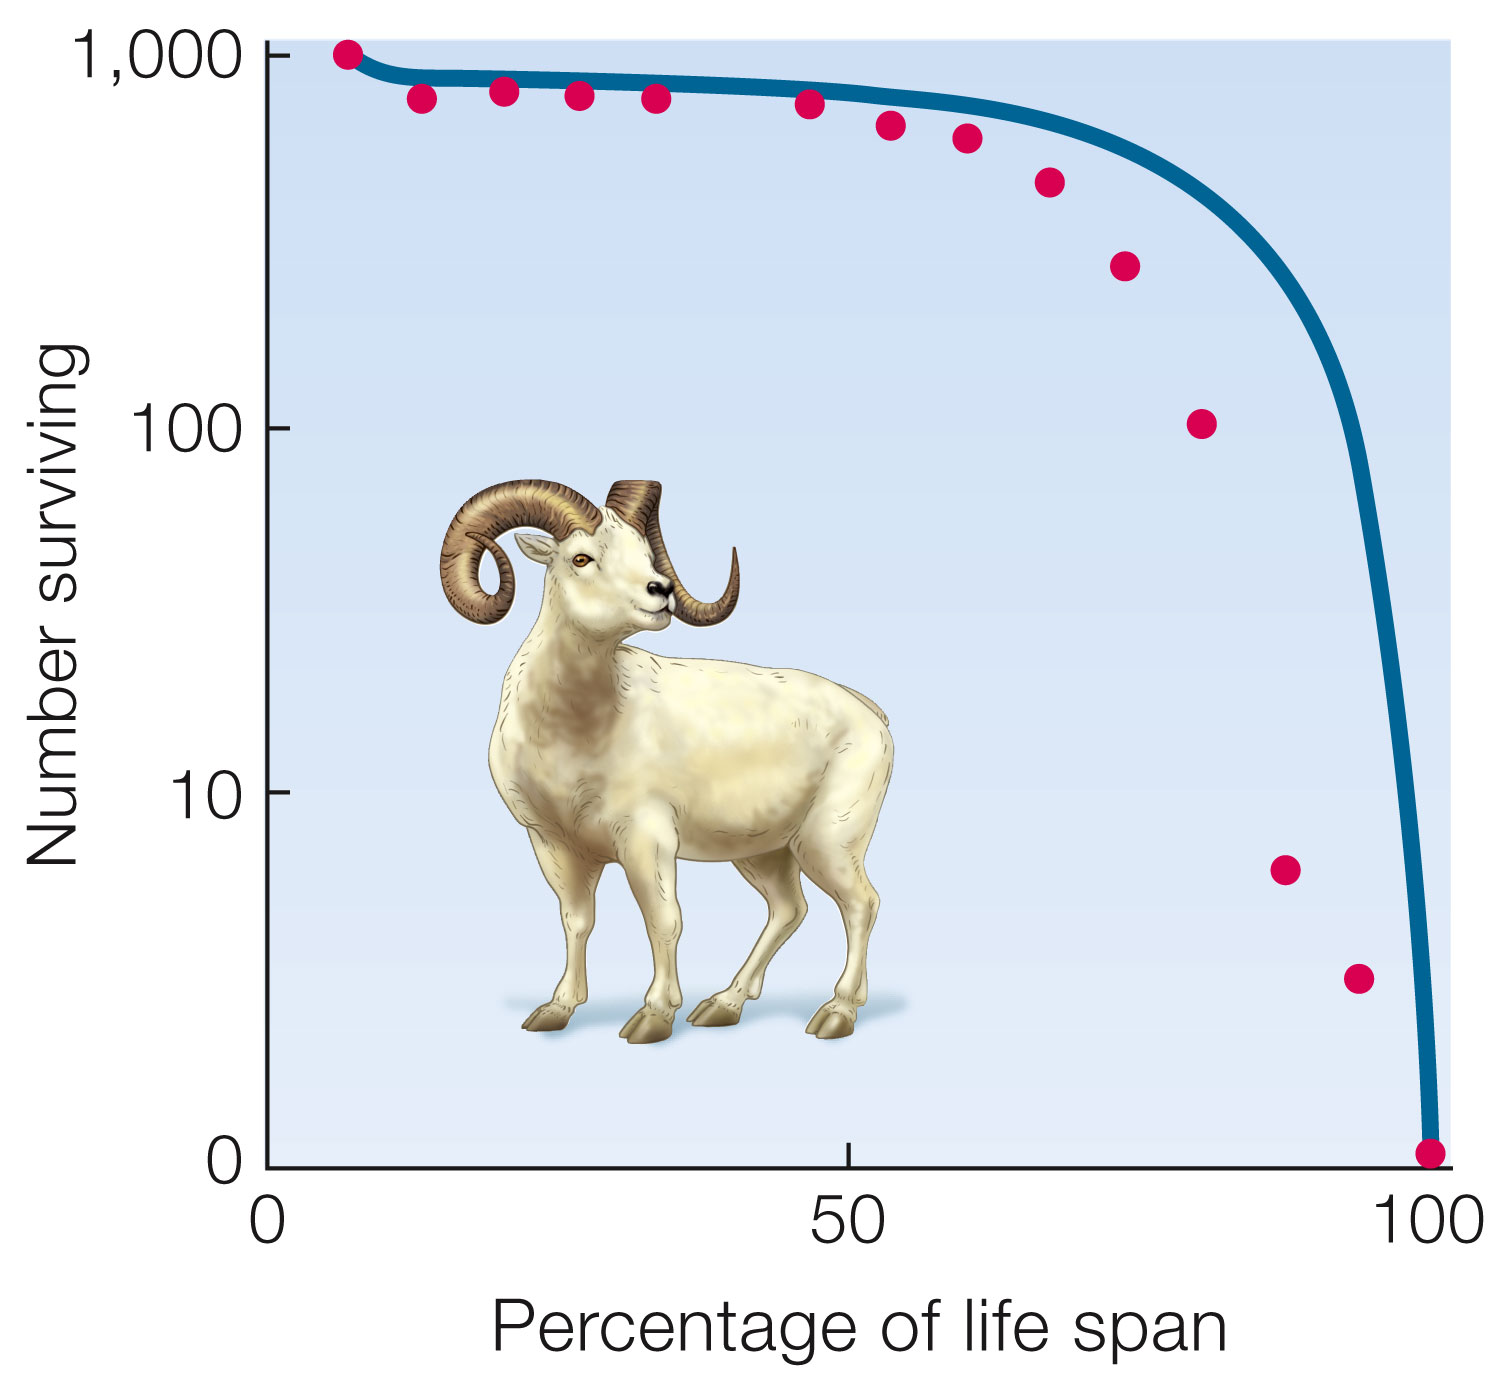
| Description: Blue lines are theoretical curves. Red dots are data from field studies. A. Type I curve. Mortality is highest very late in life. Data for Dall sheep (Ovis dalli). Picture Stats: Views: 328 Filesize: 129.84kB Height: 1381 Width: 1500 Source: https://biology-forums.com/index.php?action=gallery;sa=view;id=47181 |