 |
| Previous Image | Next Image |
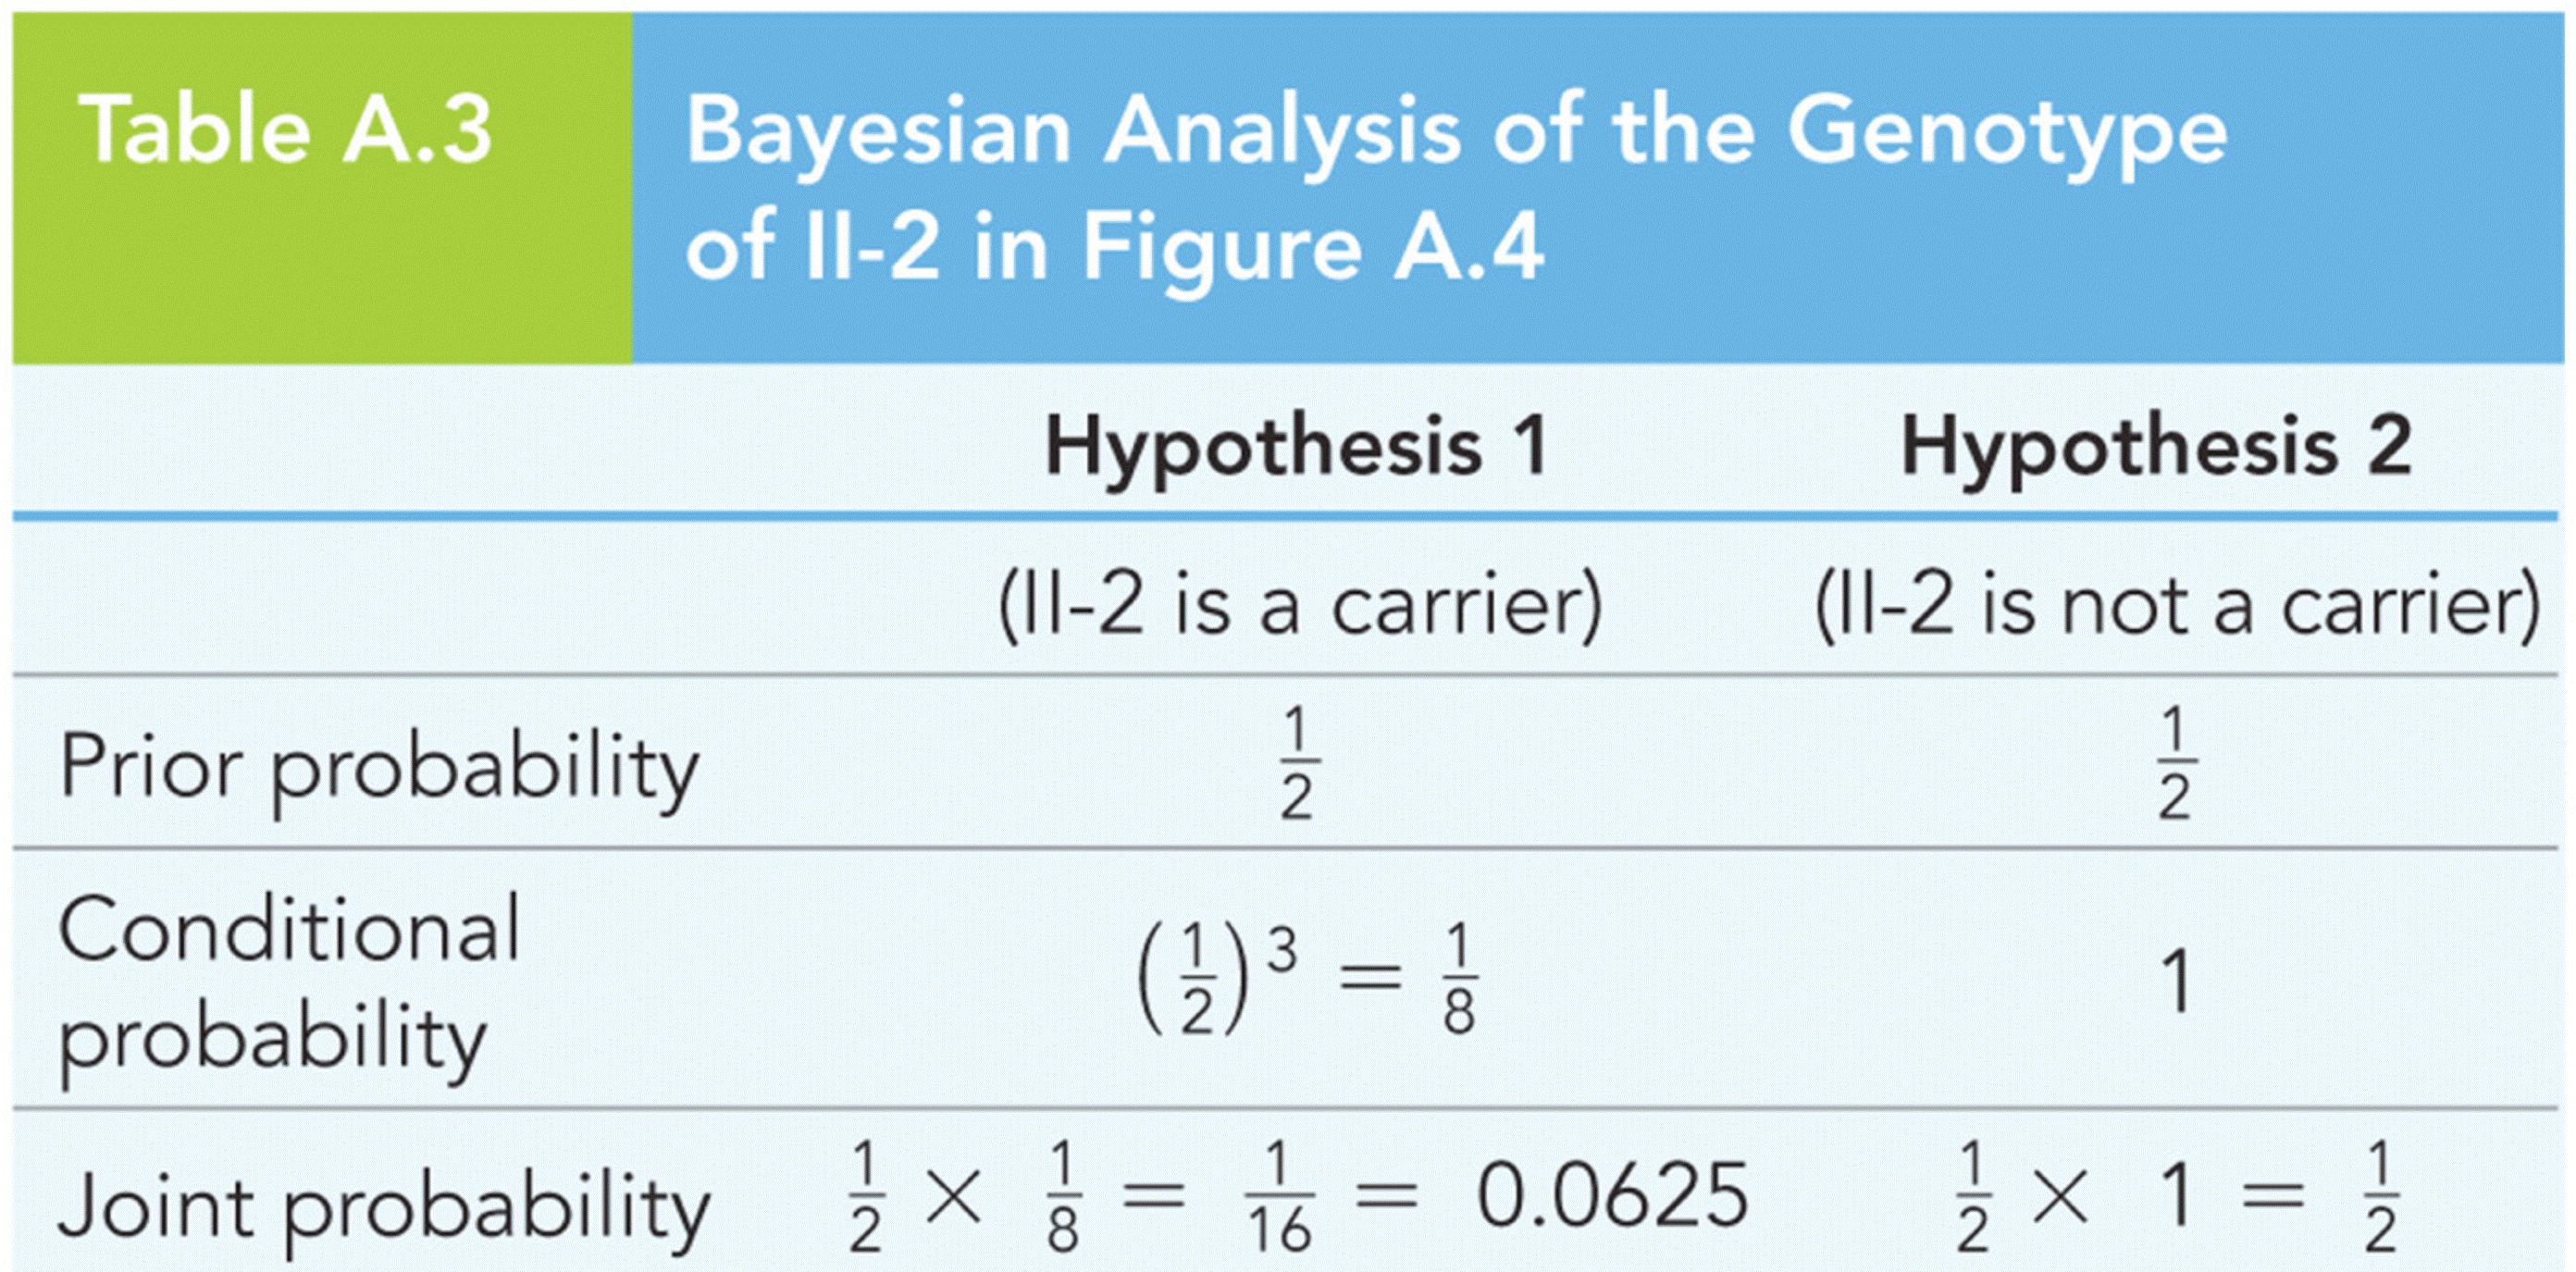
| Description: Table A.3 Hypothesis 1 Hypothesis 2 (ll—2 is a carrier) (ll—2 is not a carrier) Prior probability § § andjfion5r (1)3 = l 1 probability 2 8 Joint probability 5x 23: 16 = 0.0625 1ix 1 = %
Picture Stats: Views: 155 Filesize: 958.73kB Height: 1375 Width: 2784 Source: https://biology-forums.com/index.php?action=gallery;sa=view;id=47658 |
