 |
| Previous Image | Next Image |
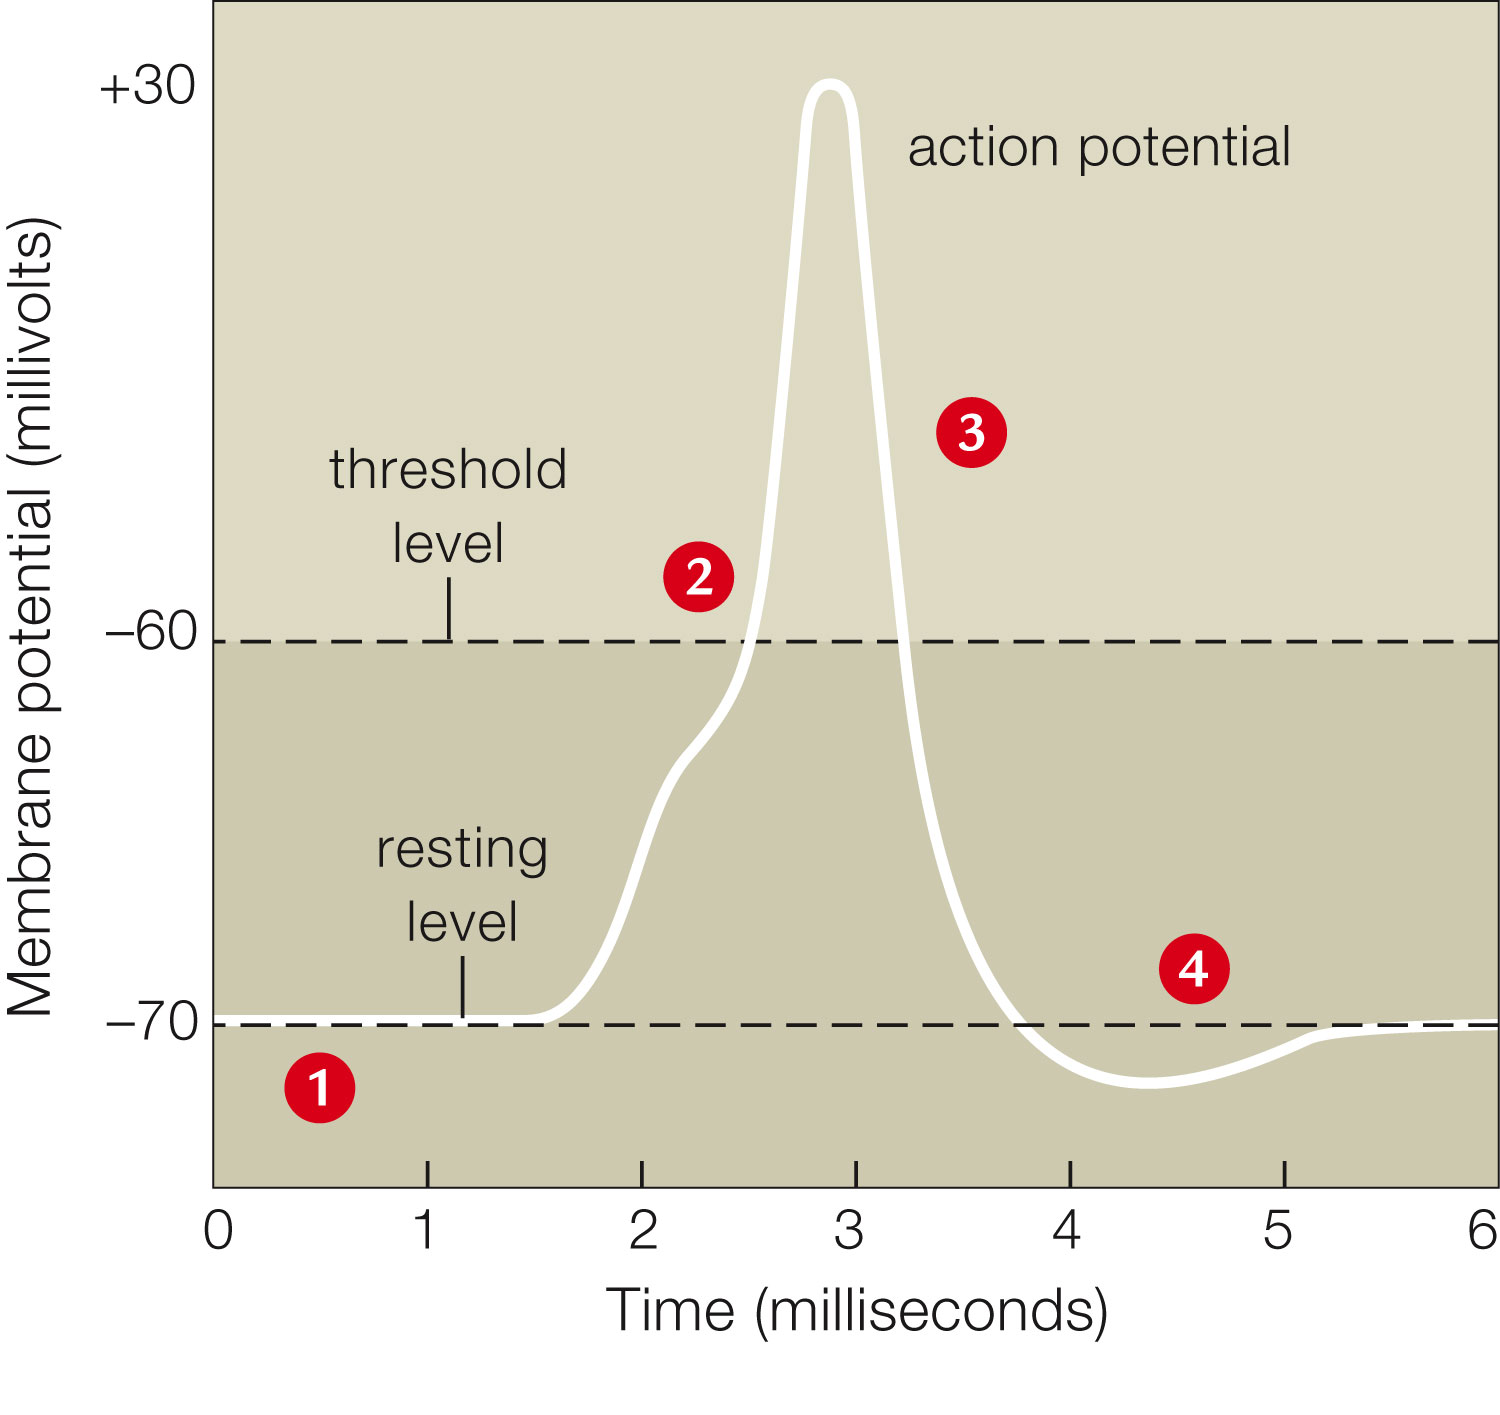
| Description: A plot of a neuron’s membrane potential over time, showing the action potential as a spike, a brief reversal of membrane potential. Right, illustration of the events at one region of an axon mem-brane. Numbers on the graph correlate with numbered graphics.
Picture Stats: Views: 858 Filesize: 112.38kB Height: 1415 Width: 1500 Source: https://biology-forums.com/index.php?action=gallery;sa=view;id=47710 Keywords: Action potential |
